
Monday, July 31, 2006
Stop it! You're Making The Baby Jesus Cry
"You know what I'm going to get you next Christmas, Mom? A big wooden cross, so that every time you feel unappreciated for your sacrifices, you can climb on up and nail yourself to it."
--Kevin Spacey, The Ref
Chris Pronger is now trying to make himself out as a martyr for his family. Yes, it is us big, bad Oilers fans who are out to destroy you, Chris. You were totally professional about things, what with the skipping town, letting your agent make the request the night before the draft, leaking the story to the media, and giving a Bill Clinton-esque performance at your "press conference"... zzzzzzzzzzzzzzzzzzzzzzzz. Hat tip to Mirtle for the story.
At least I have my own new nickname for the guy: Mom.
In other news, Ken Holland wins the non-existent "steal of the off-season award" for his signing of Dominik Hasek. Money has not been disclosed, but everyone seems to think it is in the 500K to 1.5 million range, with lots of incentives. As Avi noted to me in an email entitled Damn Red Wings, "Detroit will now have the best dollars-to-performance ratio for goaltending in the league." I couldn't agree more. And before any of you start complaining about his age and his injuries, take a look at the number-one goalie on our depth chart.
Saturday, July 29, 2006
Oilers Depth Chart: July 29, 2006
I haven't done this in a while, so I thought I would update it. I can't let Lowetide have all the speculative fun.
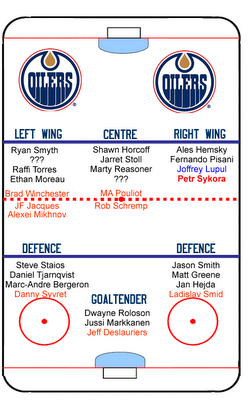
This is a depth chart. I have placed the players in the positions that the Oilers list them in. Lupul is in blue, because he is still unsigned. My assumption is that they will move either him or Pisani into the LW slot on the 2nd line, but I'm leaving it open because I don't want to have more people telling me that I have guys in the wrong positions. Sykora is in red, and is a rumoured signing. The players in orange are the Oilers top prospects, players who will likely fill out this year's roster.
(click image to enlarge)
The roster is top-heavy, which is leading some to believe that K-Lowe will make a trade for a defenceman. Torres seems to be the number one rumour. I remain unconvinced that Lowe is looking for a defenceman. I still think the plan is to go with a Sabres-like roster, rolling four good lines and a serviceable defensive core. That being said, there isn't enough room for all the forwards, assuming that at least two kids make the roster. So who knows? If no one is moved, it will certainly make for an interesting training camp.
I should also note that the big question mark for me with this roster is not the defence. It's Roloson. Will he be able to play like he did in the playoffs? Will his knee hold up? Will he be able to keep his helmet on for longer than five minutes at a time? To me, THIS is the big gamble. It's of course accentuated by a defensive core missing Chris Pronger, but if Rolli doesn't hold up Oilers fans are going to be choking back bile all year long.
This is a depth chart. I have placed the players in the positions that the Oilers list them in. Lupul is in blue, because he is still unsigned. My assumption is that they will move either him or Pisani into the LW slot on the 2nd line, but I'm leaving it open because I don't want to have more people telling me that I have guys in the wrong positions. Sykora is in red, and is a rumoured signing. The players in orange are the Oilers top prospects, players who will likely fill out this year's roster.
The roster is top-heavy, which is leading some to believe that K-Lowe will make a trade for a defenceman. Torres seems to be the number one rumour. I remain unconvinced that Lowe is looking for a defenceman. I still think the plan is to go with a Sabres-like roster, rolling four good lines and a serviceable defensive core. That being said, there isn't enough room for all the forwards, assuming that at least two kids make the roster. So who knows? If no one is moved, it will certainly make for an interesting training camp.
I should also note that the big question mark for me with this roster is not the defence. It's Roloson. Will he be able to play like he did in the playoffs? Will his knee hold up? Will he be able to keep his helmet on for longer than five minutes at a time? To me, THIS is the big gamble. It's of course accentuated by a defensive core missing Chris Pronger, but if Rolli doesn't hold up Oilers fans are going to be choking back bile all year long.
Wednesday, July 26, 2006
Holiday Road
 I'm going on a quest for fun. A Mancation. And I won't be back for three whole days. If the Sykora deal, or this rumoured Sabres/Oilers/Canucks three-way, go down while I'm gone, well then f*#@k it. Someone else will have to cover it. I'll be mad, because I like writing about threesomes, but what can I do? I gotta see a man about a Moose, and not even a--I believe the word is ménage à trois-- is gonna stop me. Camp Northstar, Wally World, here I come!!!
I'm attempting to keep in mind that this is on European ice, against non-NHLers, but this YouTube clip of Alexei Mikhnov has me dying for an agreement between the NHL and the Russian Ice Hockey Federation. I don't know if I've ever seen a player that big skate that fast. Makes you wonder if Lowetide is correct, and a bunch of Oilers forwards are going to be moved. I'm also a big fan of the soundtrack to this clip. Its got a Scorpions vibe going on that makes me want to both smash things and make sweet love to a hobo.
More Cap Stuff
Here's another site looking at salaries and team caps. The format is solid, and the numbers seem right. Hat tip to Off Wing Opinion.
Tuesday, July 25, 2006
Hemsky Signs
Six-year deal, which is fantastic. RiversQ tells us that Team 1260 is reporting $24-26 million for the deal, which I like even more. That is $4+ million a year. It's a big raise now, but by year three, or even two, it will be a flat out steal of a deal.
Personally, I think this sort of contract will be the way of the future with GMs and their own homegrown talent. The player gets the security of knowing that his money won't be eaten up by incoming free agents, and the teams don't have to worry about losing the player in two years because of ridiculous offers from elsewhere. A win/win for both sides.
Personally, I think this sort of contract will be the way of the future with GMs and their own homegrown talent. The player gets the security of knowing that his money won't be eaten up by incoming free agents, and the teams don't have to worry about losing the player in two years because of ridiculous offers from elsewhere. A win/win for both sides.
I knew it! It turns out the NHLPA didn't surrender enough...
I'm exaggerating a bit, but I don't know whether to laugh or cry at Steve Simmons' column this morning: Welcome to the expensive world of arbitration.
The good thing, I suppose, is that he has assessed the effect of salary arbitration quite correctly. Notwithstanding the club's right to walk away from any award, arbitration perverts what you might roughly call "the market" because neither the willingness nor the ability of the Club to pay are taken into account.
[Put more broadly (let's see if I can get macndub on my ass again), salary arbitration neutralizes one of the features (for the consumer) of a free market, which is that an abundance of any particular commodity will tend to depress the price of that commodity. That is: if Daniel Briere was an unrestricted free agent, his salary would depend greatly on whether there were one, five, or thirty teams interested in his services. Furthermore, his salary would also depend greatly on whether there were twenty, ten, or zero other players available offering comparable services.
Salary arbitration is blind to these factors: all the arbitrator can do is look at comparable players who have signed contracts and assign Briere a salary that is "fair".]
Anyway, the problems with Simmons' column are that I'm not exactly sure (A) what his gripe is; (B) what his proposed solution might be; and (C) if he's actually serious, or merely playing devil's advocate (or professional complainer). This is his conclusion:
Of course it's working properly. Simmons uses the weasel-phrase "many will disagree", so as I noted, I'm not sure if he's standing behind his own complaint here. But let's assume he is. He makes a couple of statements that are pretty tough to reconcile:
Back in 2003 or whenever, Stars GM Doug Armstrong was left to his own devices, and entered into a big money contract with Bill Guerin. I can only assume this arrangement was made freely by both parties, to what they believed to be their mutual benefit. Guerin's salary as a UFA did not bind any other GMs to pay other players the same amount, a la Martin Havlat ("So, the minute the geniuses who run the Chicago Blackhawks overpay for Martin Havlat -- a player comparable to Briere -- the cost is no longer in Regier's control, or budget.") And yet clearly Simmons thinks that Guerin's contract was a problem.
So what the hell does Simmons mean by Darcy Regier's own devices? Since it's clearly not the ability to freely negotiate a salary that pleases both Regier and Briere, he must mean the leverage of being able to say, "Mr. Briere, you will play for what I offer you or not at all." Mustn't he?
But back to his conclusion: he appears to be lamenting the fact that a team that drafts (or otherwise acquires) a lot of young players who make The Leap at the same time cannot afford to keep them all, and keep their roster intact. Fans of many teams will sympathize with this general statement (Edmonton c. 87-91, Calgary c. 91-96, Ottawa c. 2006, etc.). These same fans were allowed (or encouraged) to think, during the lockout, that a salary cap would mean this would never be a problem.
But the only way to accomplish this business of protecting roster makeup is to divorce player compensation from performance, past and anticipated. The system that allows a team to keep a host of players who perform well is the system that does not reward those good performances.
Maybe that's the Simmons solution. Extend the rookie salary scale to age 27 (or 31, or 35, whatever) so that all players are paid for their age and years of service. The Clubs ("both the competent and the incompetent") are happy, right? The fans are happy, right? The players will still make a great living relative to Joe Sixpack, so they're happy, right? I can't see any terrible unintended consequences arising from this system. And if there are, then the League, media, and fans can just bully the players into accepting some new and other restrictions to "fix it".
The good thing, I suppose, is that he has assessed the effect of salary arbitration quite correctly. Notwithstanding the club's right to walk away from any award, arbitration perverts what you might roughly call "the market" because neither the willingness nor the ability of the Club to pay are taken into account.
[Put more broadly (let's see if I can get macndub on my ass again), salary arbitration neutralizes one of the features (for the consumer) of a free market, which is that an abundance of any particular commodity will tend to depress the price of that commodity. That is: if Daniel Briere was an unrestricted free agent, his salary would depend greatly on whether there were one, five, or thirty teams interested in his services. Furthermore, his salary would also depend greatly on whether there were twenty, ten, or zero other players available offering comparable services.
Salary arbitration is blind to these factors: all the arbitrator can do is look at comparable players who have signed contracts and assign Briere a salary that is "fair".]
Anyway, the problems with Simmons' column are that I'm not exactly sure (A) what his gripe is; (B) what his proposed solution might be; and (C) if he's actually serious, or merely playing devil's advocate (or professional complainer). This is his conclusion:
What this CBA does is protect the league and its franchises, but not the makeup of rosters, if you understand the distinction. The league will tell you this is working properly.
In Buffalo and Phoenix and New Jersey and even with the lunatic fringe on Long Island, many will disagree.
Of course it's working properly. Simmons uses the weasel-phrase "many will disagree", so as I noted, I'm not sure if he's standing behind his own complaint here. But let's assume he is. He makes a couple of statements that are pretty tough to reconcile:
[1] When there was no salary cap, teams like the Maple Leafs and Red Wings and Stars could buy anything and everything they wanted, and that's how Bill Guerin wound up as one of the highest paid players in hockey.
[2]You see, left to his own devices, Buffalo general manager Darcy Regier probably could have made a reasonable deal with Briere. But that's where the sting comes in.
You're not left to your own devices.
Back in 2003 or whenever, Stars GM Doug Armstrong was left to his own devices, and entered into a big money contract with Bill Guerin. I can only assume this arrangement was made freely by both parties, to what they believed to be their mutual benefit. Guerin's salary as a UFA did not bind any other GMs to pay other players the same amount, a la Martin Havlat ("So, the minute the geniuses who run the Chicago Blackhawks overpay for Martin Havlat -- a player comparable to Briere -- the cost is no longer in Regier's control, or budget.") And yet clearly Simmons thinks that Guerin's contract was a problem.
So what the hell does Simmons mean by Darcy Regier's own devices? Since it's clearly not the ability to freely negotiate a salary that pleases both Regier and Briere, he must mean the leverage of being able to say, "Mr. Briere, you will play for what I offer you or not at all." Mustn't he?
But back to his conclusion: he appears to be lamenting the fact that a team that drafts (or otherwise acquires) a lot of young players who make The Leap at the same time cannot afford to keep them all, and keep their roster intact. Fans of many teams will sympathize with this general statement (Edmonton c. 87-91, Calgary c. 91-96, Ottawa c. 2006, etc.). These same fans were allowed (or encouraged) to think, during the lockout, that a salary cap would mean this would never be a problem.
But the only way to accomplish this business of protecting roster makeup is to divorce player compensation from performance, past and anticipated. The system that allows a team to keep a host of players who perform well is the system that does not reward those good performances.
Maybe that's the Simmons solution. Extend the rookie salary scale to age 27 (or 31, or 35, whatever) so that all players are paid for their age and years of service. The Clubs ("both the competent and the incompetent") are happy, right? The fans are happy, right? The players will still make a great living relative to Joe Sixpack, so they're happy, right? I can't see any terrible unintended consequences arising from this system. And if there are, then the League, media, and fans can just bully the players into accepting some new and other restrictions to "fix it".
Monday, July 24, 2006
Arbitration Update
First off, I'm told by a reliable source that the NHLPA is taking a hands-off approach to individual arbitration hearings, and it is the Agent's job to make the player's case. This is the right thing for them to do given the conflict of interest they have, but it nevertheless must be an uncomfortable (and tacit, one presumes) admission that they really can't take a keen interest in the compensation of their individual members.
Second, in that previous post on Arbitration, I was working under the assumption that it is now Final Offer Arbitration, where the Club and the Player both submit a proposed salary, and the Arbitrator is bound to select one number or the other (Tyler says the same thing here). However, upon closer reading of the CBA (Article 12) and the various news stories on the action so far, I'm no longer sure that that's the case. There's no language to that effect (that I can find) in the CBA, and the stories on (for example) Briere and York aren't specific on whether those players Won or Lost, nor on the salaries requested by either party.
Anyway, I still have some confusion on that issue; apologies if I added to yours. (And if you know of a link where this is explained in black & white, please drop it in the comments).
And lastly, NHL watchers are having a laff (and rightly so) that it was Mike Milbury standing up for the Isles at Mike York's arbitration hearing. Larry Brooks was one of them, but something else in his piece struck me as even more ridiculous:
Emphasis mine: the Islanders' submitted a proposed salary for Mike York of $1M? What? Huh? This can't be true, can it?
If I was inclined to defend Charles Wang re: the events of last week, I would have roughly said that there are no Definites in pro sports; just because no one has successfully run a team like that before doesn't mean that it's impossible and/or doomed to failure (i.e. New always looks Stupid); and that Garth Snow may end up being better than a whole lot of NHL GMs, in spite of his lack of experience. But a submission of $1M for Mike York's salary at arbitration is hard evidence of pure incompetence. They might as well not have shown up, for all the credibility they must have had in front of the Arbitrator.
Second, in that previous post on Arbitration, I was working under the assumption that it is now Final Offer Arbitration, where the Club and the Player both submit a proposed salary, and the Arbitrator is bound to select one number or the other (Tyler says the same thing here). However, upon closer reading of the CBA (Article 12) and the various news stories on the action so far, I'm no longer sure that that's the case. There's no language to that effect (that I can find) in the CBA, and the stories on (for example) Briere and York aren't specific on whether those players Won or Lost, nor on the salaries requested by either party.
Anyway, I still have some confusion on that issue; apologies if I added to yours. (And if you know of a link where this is explained in black & white, please drop it in the comments).
And lastly, NHL watchers are having a laff (and rightly so) that it was Mike Milbury standing up for the Isles at Mike York's arbitration hearing. Larry Brooks was one of them, but something else in his piece struck me as even more ridiculous:
It's true, Milbury remained mute throughout the session at which hired-gun attorney Larry Bertuzzi argued for management that York should take a $1.05M pay cut from the $2.05M he earned last season while finishing fourth on the team in scoring (13-39-52, minus-9), but still, where was anyone from the crack Board of Directors and what does this say about the fired GM's ongoing influence with the owner and what does this tell us about the owner's judgment?
Emphasis mine: the Islanders' submitted a proposed salary for Mike York of $1M? What? Huh? This can't be true, can it?
If I was inclined to defend Charles Wang re: the events of last week, I would have roughly said that there are no Definites in pro sports; just because no one has successfully run a team like that before doesn't mean that it's impossible and/or doomed to failure (i.e. New always looks Stupid); and that Garth Snow may end up being better than a whole lot of NHL GMs, in spite of his lack of experience. But a submission of $1M for Mike York's salary at arbitration is hard evidence of pure incompetence. They might as well not have shown up, for all the credibility they must have had in front of the Arbitrator.
Saturday, July 22, 2006
Weekend Activity
Here is the Edmonton Oilers All-Time Roster. Excluding the two in this picture, name your Top 5 European Oilers.
Friday, July 21, 2006
Stoll Signs
Another arbitration avoided. Two-year deal. I see no money amounts yet.
In additional news, the Oilers signed prospect Tom Gilbert.
Oh, and Geordi Laforge got a four-year extension yesterday, as well. So much for Friday being "take out the trash day." That's a good couple of days for the organization.
***Update*** It's $4.4 million over 2 years.
In additional news, the Oilers signed prospect Tom Gilbert.
Oh, and Geordi Laforge got a four-year extension yesterday, as well. So much for Friday being "take out the trash day." That's a good couple of days for the organization.
***Update*** It's $4.4 million over 2 years.
Laughable
I know Sportsnet/CP is trying to create a story out of the fact that so many Oilers from last season are no longer with the team, but cmon. First off, the only player who has left that wasn't an unrestricted free agent is Chris Pronger. Secondly, Lowe signed two of his three free agent priorities (Roloson and Pisani). Thirdly, Dvorak still hasn't signed with anyone, so you're lying. And lastly, when you include Ty Conklin in order to build up your argument, you're essentially admitting that you have no case at all. So here's my suggestion: stick with facts, rather than making up fiction.
Thursday, July 20, 2006
Real American
Unlike my last beast, I'll make this one short. Check out mc79hockey. You'll never be the same.
Incentives Matter Dept.
"We've tried to do what's right for the 700 guys and put our association in the right direction." -- Trevor Linden
With arbitration hearings starting today for ~47 players, I thought I'd bore you all by pointing out that the interests of the majority of NHLPA members would be best served if the players lost every single ruling.
I've gone over this before, but since total player compensation is fixed by the CBA, every dollar from any individual contract comes straight off the bottom line of every other player. More for the other guy means less for you, period. This is from Article 12 (Arbitration) of the CBA:
Participation at the Hearings.
A player shall be represented at the Hearing by the NHLPA unless the NHLPA chooses to delegate its authority in whole or in part, with the Player's consent, to the Player's Representative.
So for the next week, the NHLPA is in a position where it is supposed to advocate for the financial interest of a small minority of its members at the direct expense of a large majority of its members. If you're Daniel Briere, you gotta be feeling great right now, no?
The wording of that clause certainly suggests that it's up to the union, not the player, whether the player's interest is represented by his own personal agent. I don't know how it works in practice, but if I'm (say) Joffrey Lupul, I'm doing whatever I can to ensure that my agent is in that room, since he actually has a financial incentive to win.
APPENDIX:
It's tempting to sort of shrug at this; I'm not trying or expecting to elicit outrage (ooooh, if Ladislav Nagy wins his case, that's one less ivory back-scratcher for Alexei Yashin). But I'll take a quick run at the financial implications for, as a random example, new NHLPA Executive Committee member Wade Redden.
- Total player compensation will be ~$1.2B, which is ~54% of ~$2.2B in NHL revenues
- Redden makes $6.5M, which is ~(1/185th) of total player compensation, i.e. for every $185 in player compensation given to someone else, Redden pays $1.
- I count 43 players remaining on the arbitration list. There's not too many elite guys; I'm guessing for most of them, the difference between what they're requesting and what the club is offering is about ~$500k. For the bigger names (Briere, Hemsky, Nagy, etc.) that difference might be closer to $1M. I'm just going to flat out guess that the avg. difference is $600k
- In other words, the grand total difference between asked and offered for the 43 players is about $25.8M.
- So, if every player won their case, the amount surrendered by Wade Redden would be:
$25.8M x (1/185) = $140,000
You can scale that figure up and down for every other player under contract in the league.
The one saving grace for players headed into arbitration hearings is that the NHLPA does have one major incentive to perform well, and that's self-preservation. If the PA is not perceived by individual players as committed advocates on their behalf, then the rumbles will really start to grow about exactly what it is they're good for anyway. Negotiating a % once every few years? Administering a retirement plan?
On Powerplay
"Opinions are great—don't get me wrong. They're great for starting research projects. Then you go study and see if you can prove the opinion or not. But when placing multi—million dollar bets on future outcomes, opinions are wholly unsatisfactory. Opinions as conversation starters are fine. Opinions as conclusions are very bad. I started research projects to discern the objective “why.” I wanted to know why certain teams won and why other teams lost; why certain drafts produced big stars and others didn't. This was the naïve question at work."
--Paul Depodesta,
The Genesis, Implementation, and Management of New Systems
The Genesis, Implementation, and Management of New Systems
Continue reading "On Powerplay"...
Over the next little while, I am going to look at the Edmonton Oilers powerplay during the Stanley Cup Finals. The complete post is enormously large (surprise!). I started out with an opinion on the Oilers powerplay in the Finals, but had no idea if the evidence would support it. I have seen the numbers, the only numbers I was able to scrounge up, and now have more of a clue on how right and wrong I was. But I have no idea concerning the full validity or value of these numbers, or my thoughts. At this point, I am still the naive questioner searching for answers. Hopefully, these posts will bear some fruit. They took me an enormous amount of time to do, so I hope they are also of some value to others, even if the value is in how poorly the examination was performed.
During the Stanley Cup Finals between the Carolina Hurricanes and the Edmonton Oilers, there was a great deal of debate and discussion about the Oilers powerplay. Personally, I had been frustrated by the Oilers powerplay all season long, as it seemed entirely predicated on one, and only one, strategy: get the puck to the point. The strategy worked fairly well through the first three rounds, and the Oilers were able to score timely powerplay goals. In fact, they scored a powerplay goal in 13 of their first 17 playoff games.
| vs. Detroit | ||||||||
| vs. San Jose | ||||||||
| vs. Anaheim |
The powerplay had stalled in the Finals, however, as Carolina adjusted to what was, at least to my mind, the Oilers singular powerplay strategy. I was of course furious about this lack of diverse planning, as I had been all year long. Other, more moderate voices, however, suggested that the powerplay was getting better, and would come through to make a difference in the end. I didn't believe them. In between Game 5 and Game 6, I contacted Tyler and Avi, who I both knew to be statistical nutbars. An opinion was brewing in my head, and I wanted to be able to validate it. Here's how it all broke down, in present tense:
• I am intrigued by the assertion that the Oilers powerplay is getting "closer". I disagree.
• Other than Hemsky's goal in Game 5, when was the last time someone other than a player on the point took a shot on the Oilers powerplay?
• I would bet that over 80% of the Oilers shots on the powerplay throughout this series, if not throughout the entire playoffs, have been taken from the defensive side of the hashmarks.
• Based on what I know about hockey and basketball, but admittedly without much data to back me up, I want to identify those shots as being low percentage shots due to variables like distance and traffic.
• I also want to identify that a high volume of shots taken from the point also lowers their effectiveness, despite the quality of the shot-taker, due to their predictabilty.
• It also seems to me that the strategy is a waste of the talent within those players north of the hashmarks, but that probably demands a type of analysis that I am unqualified to perform.
• I want to know if anyone keeps a running tab of shots in the NHL, like they do in the NBA. I am sure stats companies do, but is any of it public? Like this:
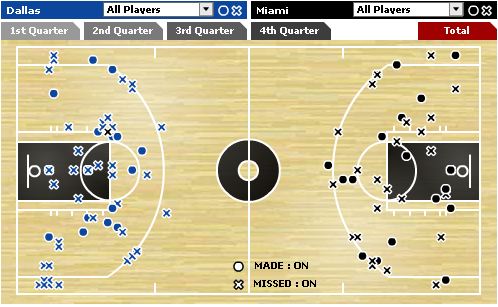
• The NBA shot chart allows me to see the shots broken down by quarter, by distance, by location, and by shooter. It also tells me which shots were made, and which shots were missed.
• What is guiding my thought process here is indeed the NBA. If a team took 80% of its shots from beyond the 3-point arc, with two defenders always in their face, they would be crucified by players, coaches, managers, reporters, fans, and even casual observers. And they would be crucified, even if they had Michael Jordan and Larry Bird taking those shots. They would be attacked even more if they had a solid supporting cast in higher percentage shooting areas that weren't taking the easier shots. Essentially, I think this is what the Oilers are doing, even though not even Chris Pronger is as good as Jordan or Bird.
• I am also aware that the NBA and NHL are two very different games, and the analogy may therefore be tenuous at best. But it is the best way I could think of to describe it.
• I suppose that at the end of the day, the success of a powerplay can be broken down into sheer results. We got one more goal in Game 5 than we did in the previous three games, so I guess it did, indeed, get better. Maybe my question really should be, "Is a poor coaching strategy inhibiting the powerplay from being even better than it currently is or becoming?"
These were the thoughts, questions and opinions running around in my head. I knew already that the guys at Hockey Analytics had done some work on shot quality, showing that indeed distance does matter. I also knew that Tyler had done some work in relation to shot quality and goaltending, but that it was different from the answers I was trying to find. Tyler has now done some more work, focusing on the powerplay, and more powerplay, but again it doesn't really cover the things I want to know. It's probably best that he didn't cover them actually, as he knew I was working on this, and I'd be forced to kill him if he posted on it before me.
Anyway, I was seemingly on my own, and would have to figure out the answers to my questions myself. So I did what any sane person looking for information on the NHL would do. I typed in www.NHL.com. And that is where my problems began.
"My chief aim in this work has been thoroughness..."
--Immanuel Kant, The Critique of Pure Reason
So what exactly was I looking for? Well, to be precise, I wanted to know where shots were taken from, their distance, and who was taking them. For every game of the Stanley Cup Finals. Once I had those, I would create a series of tables, and analyze the results. I went to NHL.com, and couldn't find a shot chart. I went to TSN, SportsNet, and Yahoo! Sports as well. Nothing. The best I could find were the play-by-play reports on NHL.com. The play-by-play reports for each game gave me some valuable information, including the time of the powerplay shot, the shooter, the type of shot, and the distance of the shot. But there were many other problems with the play-by-play reports, such as:
• They identified three kinds of powerplay shots--shots that made it through, shots that were blocked, and shots that were missed. But they didn't provide the same information for each one of these shot kinds.
• They did not tell me exactly where the shot was taken from for any of the shot kinds. They only provided distances.
• For missed powerplay shots, they didn't tell you either the distance or location.
• For blocked shots, they didn't provide the shooter, the distance, or the location.
All of these things created problems. Only providing shot distances was inadequate, because it didn't give you a full picture on the quality of those shots. Obviously no number tells you the complete story, but it would at least help to know whether a shot taken "14 feet" away is being taken from directly in front of the net, or from along the side boards. Missed powerplay shots didn't have a distance or a location listed with them, which makes them almost completely useless to look at in relation to shot quality, and therefore powerplay efficiency. And it simply blew my mind that blocked shots didn't have a distance, location, or even a shooter listed with them. It listed the blocker of the shot, but that is all. So, even though I had my suspicions that Kevyn Adams was blocking a fair share of Chris Pronger's shots from the point, because he was listed as blocking quite a few shots and I knew he played on Pronger's side on the powerplay, I couldn't in fact prove it. Exasperating, to say the least.*
I went ahead with my plans anyway, knowing full well that I might not be able to find the answers I was looking for, but hoping that I could at least gain something else from the experience (I should also note that my plan after failing to find the shot charts was to create some shot charts myself, but the further I moved along the more convinced I became of the impossibility of such a venture). The very next thing I did, after finding the play-by-play reports, was try and determine the dimensions of the NHL hockey rink. I wanted to see if the distances gave me any idea of where the shots were coming from. I eventually found up-to-date dimensions on the NHL Officials page, and a bit of an explanation for them in the NHL Rule Book.
Looking at the map, I found that there is 75 feet between the backboards and the blueline. I discovered that the distance from the goal line straight out to the slot is 20 feet. The distance between the blueline and the goal line is 64 feet, so I started with the assumption that a decent shot is anything under half that distance, 32 feet or less. Having that information, as well as the incomplete information from the play-by-play reports, I began inputting the data into Excel spreadsheets.
I was almost done inputting the data for Games 1 to 5, and beginning to see some mildly interesting things, when I got an email from Tyler. He told me that the distances the NHL provides in the play-by-play reports are the subject of some controversy. Apparently Vic insisted that they are measured from the backboards, rather than from the goal line. Tyler disagreed, noting that it made no sense to calculate them in that manner. I hadn't even thought of it myself, completely assuming that they were being calculated from the goal line. Yet I knew there was a way I could verify how the shot distance was being calculated. In Period 3 of Game 1 of the Finals, Ales Hemsky had scored a beautiful goal on the powerplay. He had done so by dancing around a couple of players, and then deking out Cam Ward on the goal line to score. If Tyler and I were correct, the goal would be marked at a distance near or around 0 feet. If Vic was correct, the goal distance would be identified at around 11 feet. I took a peak at my spreadsheet...and saw that Vic was correct. Hemsky's goal was listed at 12 feet.
I took the night off after that one. While in hindsight I understand how the NHL would think to tabulate the distance in this manner--they might think that they would be forced into noting that Wayne Gretzky scored a ton of points from a negative distance--it also seems counter-intuitive. If the point is to score a goal on a net, couldn't and shouldn't the distance be marked as the space between said net and the player, regardless of where he is on the ice? Doesn't a combination of a distance from the player to the goal, as well as a shot chart to provide locational context, solve the problem in a simple manner? Of course the real problem was that I couldn't even find an explanation on how the NHL calculates shot distances. I still don't know for sure. All I have to go on is the numbers they do provide, and my memory of that one goal. Like with the rest of my statistical hunting for this project, I found the whole thing preposterous.
Once I got back at it, I had to redo some of my numbers, based on the fact that I now had to declare anything under 37.5 feet to be a decent shot. It changed my findings, in a dramatic manner. Shots in the 32-37.5 foot range, which I had initially marked down as poor shots, now made the quality cut. I countered this by adding a new range of quality shots, that being the distance from the backboards to the face-off dot in the offensive zone. 31 feet and less. This creates a problem at least once, but you'll see that later.
Near the completion of entering the redone information for Games 1-5, I discovered, thanks to Avi, shot charts. Ahhh. At last. Shot charts. From CBS Sportsline. Initially I was ecstatic, because they looked similar to the NBA charts.
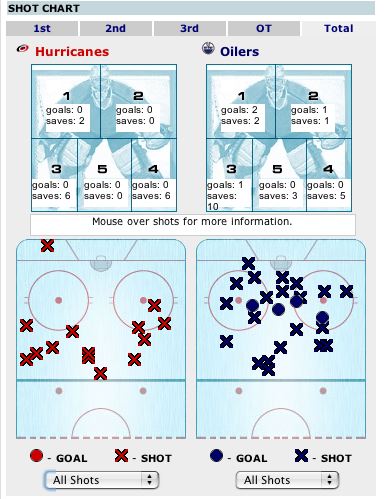
I could see where the shots were taken from, see who took them, and see all it by period or grand total. If I moved my mouse over the X's and O's, I could even see what zone of the net the shot was taken on. My plan was to simply cross the data I had already found with these shot charts. I still wouldn't have all the information about missed shots and blocked shots, but I would at least have a clearer idea on the shots that got through to Cam Ward. I thought I might even be able to expand my scope, and see where Carolina were taking their powerplay shots from, as a point of comparison.
That plan didn't last for very long. It took me about an hour, but I eventually realized the shot charts on CBS didn't square with the official play-by-play reports of the NHL. For one thing, the shot times didn't align. It wasn't just that CBS kept track of the time by counting down, like European hockey clocks, rather than up, like the NHL clock. The times were just off, often noticeably off. For another, the CBS chart was giving credit to players for shots that the NHL did not give. The total number of shots were the same, but the shooters themselves differed. I was foiled yet again. If I had come upon the CBS site first, I probably never would have been aware of the discrepancies, and gone about my business in a happy but ultimately erroneous manner. But I had come across the official-play-by-play results of the NHL first, and was therefore back to square one. The irony wasn't lost on me, either, that the existence of incomplete, scattered, mostly useless, but official NHL statistics had ruined my chances of getting the information I needed from a more complete, valuable, but non-official source at CBS.
Fed up with it all, I stopped doing the work. I wouldn't pick it up again for a few weeks. By that time, the Oilers had lost the Stanley Cup.
*As I went to post this tonight, I decided to take another look at the stats on NHL.com. I took a look again at the offensive supersheets and the shift charts. I was suddenly terrified that the information had been there for me all along, and I had just missed it. The offensive supersheets list blocked shots and missed shots by who shot them, which is at least an upgrade from the play-by-play reports for the blocked shots. But you can't tell if the shots were taken on the powerplay or at even strength, and you don't know distance or location. You also don't know what period they were blocked or missed in. Even cross-referencing them with the shift charts won't work, because the players taking the missed and blocked shots on the powerplay are probably playing at the same time. I may be wrong, but I think the full information is still missing. To be honest, I hope it is now. If it is there for me to see, I'm going to have to re-write the remaining three posts. I think I'd rather die than have to do that.
"Pure mathematics is, in its way, the poetry of logical ideas. One seeks the most general ideas of operation which will bring together in simple, logical and unified form the largest possible circle of formal relations."
--Albert Einstein, New York Times, on the death of Emmy Noether
Legend
• Red Font Indicates Canes Player Blocking Powerplay Shot
• Blue Font Indicates Oilers Powerplay Goal
• Purple Font Indicates Missed Powerplay Shot
• Shots Blocked And Missed Do Not Indicate Where They Were Shot From
• Blocked Shots Do Not Indicate Who Shot, But Who Blocked
• 37.5 Feet Is Half The Distance From The Blueline To The End Board
• 31 Feet Is The Distance From The End Boards To The Line On Which The End Zone Faceoff Circles Are Placed
• I Do Not Differentiate Between a 5 on 4 and a 5 on 3 Powerplay
• I Count The Goalpost As A Shot, Not As A Missed Shot Like The NHL
• * Indicates My Own Determination Of Shot Distance
| 1st Period | ||||
| Shot | ||||
| Missed Shot | ||||
| Shot | ||||
| Blocked Shot | ||||
| Missed Shot | ||||
| Blocked Shot | ||||
| Shot | ||||
| Blocked Shot | ||||
| Blocked Shot | ||||
| 2nd Period | ||||
| 3rd Period | ||||
| Blocked Shot | ||||
| Shot | ||||
| Shot | ||||
| Shot | ||||
| Shot | ||||
| Goal | ||||
| Summary | ||||
| Shots Missed | ||||
| Shots Blocked | ||||
| Shots Through | ||||
| Total Shots On Net | ||||
| Shots Through From <37.5 Feet | ||||
| Shots Through From >37.5 Feet | ||||
| Shots Through From <31 Feet | ||||
| Powerplay Success/Game | ||||
| Powerplay Success/% | ||||
| Total Powerplay Time | ||||
| Game 1 Play-By-Play | ||||
| Game 1 Scoresheet | ||||
| Game 1 GameCenter |
| 1st Period | ||||
| Blocked Shot | ||||
| Blocked Shot | ||||
| Blocked Shot | ||||
| Blocked Shot | ||||
| Blocked Shot | ||||
| Missed Shot | ||||
| Missed Shot | ||||
| Shot | ||||
| Blocked Shot | ||||
| Missed Shot | ||||
| 2nd Period | ||||
| Shot | ||||
| Shot | ||||
| Missed Shot | ||||
| 3rd Period | ||||
| Missed Shot | ||||
| Shot | ||||
| Missed Shot | ||||
| Missed Shot | ||||
| Summary | ||||
| Shots Missed | ||||
| Shots Blocked | ||||
| Shots Through | ||||
| Total Shots On Net | ||||
| Shots Through From <37.5 Feet | ||||
| Shots Through From >37.5 Feet | ||||
| Shots Through From <31 Feet | ||||
| Powerplay Success/Game | ||||
| Powerplay Success/% | ||||
| Total Powerplay Time | ||||
| Game 2 Play-By-Play | ||||
| Game 2 Scoresheet | ||||
| Game 2 GameCenter |
| 1st Period | ||||
| Shot | ||||
| Shot | ||||
| Missed Shot | ||||
| Blocked Shot | ||||
| Missed Shot | ||||
| Missed Shot | ||||
| Blocked Shot | ||||
| Blocked Shot | ||||
| Blocked Shot | ||||
| Missed Shot | ||||
| 2nd Period | ||||
| Shot | ||||
| Blocked Shot | ||||
| Missed Shot | ||||
| Blocked Shot | ||||
| 3rd Period | ||||
| Shot | ||||
| Missed Shot | ||||
| Shot | ||||
| Missed Shot | ||||
| Summary | ||||
| Shots Missed | ||||
| Shots Blocked | ||||
| Shots Through | ||||
| Total Shots On Net | ||||
| Shots Through From <37.5 Feet | ||||
| Shots Through From >37.5 Feet | ||||
| Shots Through From <31 Feet | ||||
| Powerplay Success/Game | ||||
| Powerplay Success/% | ||||
| Total Powerplay Time | ||||
| Game 3 Play-By-Play | ||||
| Game 3 Scoresheet | ||||
| Game 3 GameCenter |
| 1st Period | ||||
| Blocked Shot | ||||
| Shot | ||||
| Missed Shot | ||||
| Shot | ||||
| Shot | ||||
| Shot | ||||
| Shot | ||||
| Blocked Shot | ||||
| Blocked Shot | ||||
| 2nd Period | ||||
| Missed Shot | ||||
| Missed Shot | ||||
| Shot | ||||
| Blocked Shot | ||||
| 3rd Period | ||||
| Summary | ||||
| Shots Missed | ||||
| Shots Blocked | ||||
| Shots Through | ||||
| Total Shots On Net | ||||
| Shots Through From <37.5 Feet | ||||
| Shots Through From >37.5 Feet | ||||
| Shots Through From <31 Feet | ||||
| Powerplay Success/Game | ||||
| Powerplay Success/% | ||||
| Total Powerplay Time | ||||
| Game 4 Play-By-Play | ||||
| Game 4 Scoresheet | ||||
| Game 4 GameCenter |
| 1st Period | ||||
| Shot | ||||
| Blocked Shot | ||||
| Missed Shot | ||||
| Blocked Shot | ||||
| Goal | ||||
| Goalpost | ||||
| 2nd Period | ||||
| Shot | ||||
| Missed Shot | ||||
| Shot | ||||
| 3rd Period | ||||
| Blocked Shot | ||||
| Blocked Shot | ||||
| Shot | ||||
| Blocked Shot | ||||
| Missed Shot | ||||
| Shot | ||||
| Blocked Shot | ||||
| Missed Shot | ||||
| Blocked Shot | ||||
| Summary | ||||
| Shots Missed | ||||
| Shots Blocked | ||||
| Shots Through | ||||
| Total Shots On Net | ||||
| Shots Through From <37.5 Feet | ||||
| Shots Through From >37.5 Feet | ||||
| Shots Through From <31 Feet | ||||
| Powerplay Success/Game | ||||
| Powerplay Success/% | ||||
| Total Powerplay Time | ||||
| Game 5 Play-By-Play | ||||
| Game 5 Scoresheet | ||||
| Game 5 GameCenter |
| 1st Period | ||||
| Shot | ||||
| Shot | ||||
| Blocked Shot | ||||
| Blocked Shot | ||||
| Shot | ||||
| Shot | ||||
| 2nd Period | ||||
| Shot | ||||
| Goal | ||||
| Missed Shot | ||||
| Shot | ||||
| Shot | ||||
| 3rd Period | ||||
| Goal | ||||
| Shot | ||||
| Blocked Shot | ||||
| Shot | ||||
| Shot | ||||
| Shot | ||||
| Goal | ||||
| Summary | ||||
| Shots Missed | ||||
| Shots Blocked | ||||
| Shots Through | ||||
| Total Shots On Net | ||||
| Shots Through From <37.5 Feet | ||||
| Shots Through From >37.5 Feet | ||||
| Shots Through From <31 Feet | ||||
| Powerplay Success/Game | ||||
| Powerplay Success/% | ||||
| Total Powerplay Time | ||||
| Game 6 Play-By-Play | ||||
| Game 6 Scoresheet | ||||
| Game 6 Game Center |
| 1st Period | ||||
| Shot | ||||
| Blocked Shot | ||||
| Blocked Shot | ||||
| Missed Shot | ||||
| 2nd Period | ||||
| Shot | ||||
| Blocked Shot | ||||
| Missed Shot | ||||
| Shot | ||||
| Shot | ||||
| 3rd Period | ||||
| Blocked Shot | ||||
| Missed Shot | ||||
| Blocked Shot | ||||
| Blocked Shot | ||||
| Summary | ||||
| Shots Missed | ||||
| Shots Blocked | ||||
| Shots Through | ||||
| Total Shots On Net | ||||
| Shots Through From <37.5 Feet | ||||
| Shots Through From >37.5 Feet | ||||
| Shots Through From <31 Feet | ||||
| Powerplay Success/Game | ||||
| Powerplay Success/% | ||||
| Total Powerplay Time | ||||
| Game 7 Play By Play | ||||
| Game 7 Scoresheet | ||||
| Game 7 Game Center |
"Who says there's an unemployment problem in this country? Just take the five percent unemployed and give them a baseball stat to follow."
Well, there you have it. All of my numbers for Games 1-7 of the Stanley Cup Finals. To recap, here are some of my more interesting findings:
| Powerplay Shots | ||||
| Shots Missed | ||||
| Shots Blocked | ||||
| Shots Through | ||||
| Total Shots On Net | ||||
| Powerplay Shots Through | ||||
| Shots Through | ||||
| Shots Through From <37.5 Feet | ||||
| Shots Through From >37.5 Feet | ||||
| Shots Through From <31 Feet | ||||
| *15 Of These Shots Occurred In Games 1 & 6 | ||||
| **14 Of These Shots Occurred In Games 1 & 6 | ||||
| Powerplay Success/Game | ||||
| Powerplay Success/% | ||||
| Total Powerplay Time |
• 57% of Edmonton's powerplay shots in the Finals didn't even make it on the net.
• 52% of the shots that actually got through to the net were from less than 37.5 feet.
• 48% of the shots that actually got through to the net were from more than 37.5 feet.
• 44% of the shots that actually got through to the net were from less than 31 feet.
• Excluding Games 1 and 6, 38% of the shots that actually got through to the net were from less than 37.5 feet.
• Excluding Games 1 and 6, 62% of the shots that actually got through to the net were from more than 37.5 feet.
• Excluding Games 1 and 6, 27% of the shots that actually got through to the net were from less than 31 feet.
• One of the through shots in Game 6--by Ethan Moreau--was marked at a distance of 6 feet. That means it was taken from behind the net.
| Bergeron | |||||
| Hemsky | |||||
| Horcoff | |||||
| Moreau | |||||
| Peca | |||||
| Pisani | |||||
| Pronger | |||||
| Samsonov | |||||
| Smyth | |||||
| Spacek | |||||
| Staios | |||||
| Stoll | |||||
| Torres | |||||
| Total |
• Chris Pronger took 25% of the Oilers shots that got through to the net.
• Every one of Pronger's shots that got through were from beyond 37.5 feet.
• Chris Pronger took 24% of the Oilers missed and through shots.
• Oilers defencemen took 40% of the Oilers shots that got through to the net.
• Oilers defencemen took 41% of the Oilers missed and through shots.
• Bergeron, Pronger, Spacek, Staois and Stoll took 52% of the Oilers shots that got through to the net.
• Bergeron, Pronger, Spacek, Staois and Stoll took 52% of the Oilers missed and through shots.
• Pronger and Spacek took 44% of the Oilers missed shots.
• Pronger, Spacek, and Stoll took 52% of the Oilers missed shots.
| vs. Detroit | |||||||||
| vs. San Jose | |||||||||
| vs. Anaheim | |||||||||
| vs. Carolina |
• The Oilers scored a powerplay goal in 5 of the 6 games in Round One.
• The Oilers scored a powerplay goal in 4 of the 6 games in Round Two.
• The Oilers scored a powerplay goal in 4 of the 5 games in Round Three.
• The Oilers scored a powerplay goal in 3 of the 7 games in Round Four.
• The Oilers overall powerplay success decreased through every round of the 2006 playoffs.
• Excluding Game 6, the Oilers powerplay success rate was 5.5% in the Stanley Cup Finals.
"Now the partisan, when he is engaged in a dispute, cares nothing about the rights of the question, but is anxious only to convince his hearers of his own assertions. And the difference between him and me at the present moment is merely this--that whereas he seeks to convince his hearers that what he says is true, I am rather seeking to convince myself; to convince my hearers is a secondary matter with me."
--Plato, Phaedo
Taking a look back at my original queries and opinions, I would say that I was both bang on and totally off, with a healthy dose of "who the hell really knows" thrown in the mix.
Question: Did the Oilers powerplay get "closer" to being good as the series against Carolina went along?
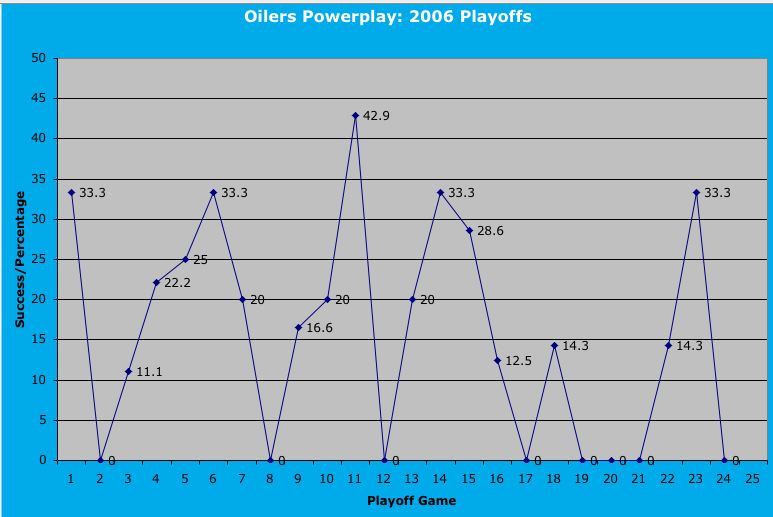
Answer: I certainly don't think so. As the numbers in Part IV show, the Oilers powerplay success rate dropped through every single round of the playoffs. They started out with a 21.6% success rate against the Wings in Round 1, and ended up at 11% by the end of the Finals. The graph in Part IV also doesn't indicate any growing strength in the seven games against the Canes. The Oilers did score three powerplay in Game 6, but they went back to scoring 0 in Game 7. The powerplay success rate in the Finals is especially alarming if you consider that the Game 6 success bumped up the percentages by 5.5%. The Oilers shouldn't be criticized for scoring powerplay goals in Game 6, but it really was the exception to the rule in the Finals.
Question: Other than Hemsky's goal in Game 5, when was the last time someone other than a player on the point took a shot on the Oilers powerplay?
Answer: It actually happened a minute and thirteen seconds before Hemsky's goal, on a shot from Raffi Torres. Clearly an absurd claim on my part. But a 33 foot shot from Mike Peca at 16:23 of the first period, in Game 4, was the last time a shot from less than 37.5 feet was taken before that. That's about 55 minutes of space in between shots from somewhere other than the point.
Question: Did over 80% of the Oilers shots on the powerplay throughout the Finals come from beyond 37.5 feet?
Answer: No. That number is much lower, at about 48%. But several points should be made here. The first is that the number goes up by 14 points, to 62%, if you take out the 15 shots the Oilers shot from less than 37.5 feet in Games 1 and 6. If you take out Games 1 and 6, and look at shots from less than 31 feet, the numbers change even more. Excluding those two games, 73% of the Oilers shots were taken from beyond 31 feet.
It should also be noted that this doesn't count missed and blocked shots. 57% of Edmonton's powerplay shots in the Finals didn't even make it on the net. 37 shots were blocked, and 27 were missed. Jaroslav Spacek had 6 missed shots, and so did Chris Pronger. All of Pronger's shots that actually got through to the net were from beyond 37.5 feet. Is it reasonable to assume that all of his missed shots were also from beyond that distance? Of the 5 shots Spacek got through to the net, 4 were from beyond 37.5. Do I make a similar assumption with him? That's an extra 9 or 10 shots added to list, which would surely raise the percentage of shots from beyond 37.5. And what about those 37 blocked shots that I have no distance or shooter for? How many were taken from beyond 37.5 feet? It's all speculation, obviously, but I think the numbers are misleading, and much closer to my 80% guess than they are with the incomplete statistics.
Question: Did over 80% of the Oilers shots on the powerplay throughout the 2006 Playoffs come from beyond 37.5 feet?
Answer: I don't know. The only thing I bothered to look at for the other three rounds was the overall playoff success rate. The lack of statistical data was going to prevent me from even seeing a complete picture of the Finals. I wasn't about to waste another 50 hours looking at more incomplete information.
Question: Can you verify that shots at a distance beyond 37.5 feet are low percentage?
Answer: No. But others can, and have. Take a look at the graph from Alan Ryder's work on shot quality.

The numbers are from the 2002-2003 season, but I see no reason why the arc would have changed dramatically. Statistically speaking, distance matters, and the closer the shot, the better.
Question: Can you verify that a high volume of shots taken from the point also lowers their effectiveness, despite the quality of the shot-taker, due to their predictabilty?
Answer: Again, no. I think the way to do this would be to monitor the Oilers' success on the powerplay throughout the entire season, as well as the playoffs. Then you could properly determine the percentage of shots taken from the point all year (assuming that you could actually get this data, which as I have shown, you can't), how well an opposing team adjusted to the strategy, and whether that affected their powerplay success rate. But the Oilers powerplay success rate did drop in each consecutive round of the playoffs, and that has to count for something, even if it is a small something.
Question: Can you verify that a powerplay strategy primarily focused on the point shot is a waste of the talent within those players north of the hashmarks?
Answer: I didn't even try. I wouldn't even know where to begin on that one. Maybe a cost/benefit analysis? You've got me. It is a neat concept though, and raises some interesting questions. Are kids with "better hands" placed at the forward positions, or do they develop "better hands" because they are placed in the forward positions? It also relates to the question before this. How important is shot distribution? When should the puck be placed on the stick of your best shooter? And so on.
Question: Does anyone keep a running tab of shots in the NHL, like they do in the NBA? And is it public?
Answer: Part II deals with this, and the answer is yes and no. CBS Sportsline does have a shot chart, and it has similar functions to the shot charts the NBA publishes. But the information on them doesn't align with the information on NHL.com, so their value is questionable. My guess is that CBS and the NHL use different companies to keep track of things, which creates the discrepancy. It does illustrate the subjectivity of the NHL statistics many take to be Gospel, however. Those statistics are still being tabulated by human beings, and I'm 100% certain they are making subjective judgments on things like shots, in the same way that baseball scorers make subjective judgements on things like hits and errors.
Question: Was a poor coaching strategy inhibiting the Oilers powerplay?
Answer: While admitting that I don't have all the data, yes. This is obviously a complicated question with many different aspects, and my whole goal has been to try and sort through it all. My failure to answer this question as completely as I could is, at least to me, no fault of my own. As a point of fact, the end result of this entire post may not so much be an indictment of the Oilers powerplay, but rather an indictment of the NHL's incomplete statistical gatherings. I do not know the location of any of the Oilers powerplay shots. I do not know how the NHL gauges shot distance. I do not know the distance or the location of missed powerplay shots. I do not know the distance, location or shooter of blocked powerplay shots. Without this data, I am prevented from seeing what I would like to see. I am blinded from truly knowing whether I am right or wrong about the Oilers powerplay.
But there are some things I do know for certain. I do know that the Oilers powerplay success rate declined through each consecutive round of the playoffs. I also know for sure that every single powerplay goal the Oilers did score in the Finals was from less than 31 feet, the distance from the slot to the back boards. I know for certain that Chris Pronger took the majority of missed and through shots on the Oilers powerplay, doubling the amount of the two next closest forwards (Ales Hemsky and Ryan Smyth). I know for certain that fellow defenceman Jaroslav Spacek had the next highest amount of missed and through powerplay shots. I know for certain that every single one of Pronger's through shots were taken from beyond 37.5 feet. I also know for certain that in Game Six, when the Oilers scored 3 of their 5 Finals powerplay goals, they took 9 shots from 31 feet or less. That was half of their total shots through for that game, and a substantially larger number of shots from that distance than they took in any other Finals game. These things I know.
The hockey powerplay is unique in North American professional sports. No other major professional sport on this continent allows the rules--and the breaking of them--to create such a regularly distinct offensive advantage and opportunity. The free throw exists in basketball, and it is likely the closest comparison, yet it is functionally different from the powerplay. There, a player gets one to three uninterrupted shots from a mandated distance. But regular play is stopped, and the shooter works alone. In hockey, the penalized player leaves the ice, and regular, team play, resumes. As such, it is difficult to draw analogies on the best strategies for success. Yet like in basketball, and even football, certain things are critical if teams wish to succeed. Things like ball and puck distribution come to mind, as well as maximizing your odds by taking shots at the right time, with the right players.
It is my contention that the Edmonton Oilers failed in this regard during the 2006 Stanley Cup Finals. They placed too much emphasis on having their powerplay shots come from certain players, at certain distances. Those distances were not statistically advantageous, leading to a decline in powerplay success rate. In addition, because of the repetition of the act, the Carolina Hurricanes were able to key in on certain players and a certain distance from the ice, again leading to a decline in powerplay success rate. It was the equivalent, in my mind, of having one or two players consistently taking a 3-point shot in basketball. The distance leads to a poor success rate, and after a while, the opposing team gets a lot of hands in the faces of those shooters. The success rate plummets. Another equivalent might be a football team consistently attempting to throw fifty-yard passes, to the same receiver. Again, the distance is inopportune, and after a while a team just starts keying in on the route.
It is my belief that the Oilers should have developed a better powerplay strategy, focused on the activities of better puck circulation and shot distribution, eventually culminating in taking high percentage shots from high percentage places. That is why I made the suggestion, after Game 4, that the Oilers dress Robbie Schremp for the rest of the playoffs. Tyler disagreed with me, stating among other things that as a replacement player Schremp's value was less than other players in the lineup, and that looking at the 82 games in the regular season proved that the Oilers powerplay was simply better than the Canes penalty kill. Of course he did this all without any actual VORP numbers, and by ignoring the fact that Carolina hadn't played Edmonton 82 times that year, and that adjustments had clearly been made to shut down the Oilers singular powerplay strategy, but I digress. I suggested in his comments that Schremp shouldn't be thought of as a real player, but as a metaphor. Here is my explanation for that statement. My point was that what the Oilers needed at that time wasn't another defenceman or forward who liked to take howitzers from 60 feet away, but a forward with good hands and a fearless ability to shoot from close distances. I really didn't care who it was, as long as it happened. I know that ultimately without a reformulated plan of attack from Craig Simpson and Craig MacTavish, the personnel wouldn't matter. But my belief was that Schremp was egotistical enough to ignore the plan of attack, and shoot from 25 feet or less anytime he touched the puck.
I stand by my suggestion even now, though I believe I should have suggested that Tyler think of Schremp as a change in philosophy, rather than as a metaphor. There is an orthodoxy in the game of hockey, as there is in every sport. I believe this orthodoxy, this stubborn refusal to change or modify beliefs and strategies in the face of predictive or actual failure, cost the Edmonton Oilers the Stanley Cup. I believe that more shots from less than 37.5 feet, more variety in the shooters taking those shots, all mixed with the occasional blast from the point, would have allowed the Oilers to score 2 to 4 extra goals in the Finals. My belief is especially strong considering the many 5-on-3 chances the Oilers had in the Finals, which I didn't even begin to discuss in this post. 2 to 4 extra goals would have made a big difference, likely a big enough difference to bring the Stanley Cup back to Edmonton, where it so rightly belongs. Chris Pronger would have still left town, but we'd have all been too drunk to care.
![]()
