
Friday, December 01, 2006
Friday Stats Watch
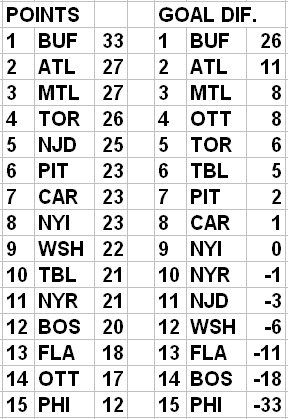
I keep forgetting to post this: like last year, I'm going to track the quarterly results in the conferences. Boston was the last team to play their 20th game, on Friday Nov. 24th (ATL played their G20 on the 11th; I was surprised to see that big a variation in Schedule Compression, or whatever you want to call it). The East:

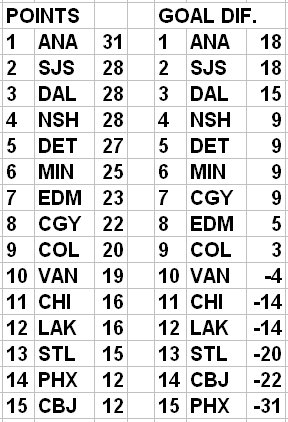
And the West:

There's not much to comment on here, I mainly post it at a reference point for the 2nd/3rd/4th quarter updates. The one thing, I suppose, is the Senators.
Everybody knew -- subjectively -- that the Sens were a better team than their early season record. Tyler (among others) made a objective case as well. And, their performance in the early part of the 2nd quarter (10 points in 6 games) bears all of it out.
But in the grand scheme, there's got to be a certain point where the fact that so many of their wins are blowouts ceases to be impressive weighed against their close losses, and it's appropriate to wonder if there really is an underlying issue there, whether it's character, coaching, or what.
The Sens were 13th in the conference in points but T-3rd in GD. They were +6 in their 4 games against the Leafs (3W/1L), and the loss was 6-0 -- they were +12 in the 3 W's. They beat the Devils 8-1 in there too, right on the heels of a 4-game stretch where they lost 3 1-goal games and won a shootout.
Stats types use the word "luck" to describe how goals (for & against) are distributed, and rightly so for the most part. The reason is that generally, when a team (standings-wise) underperforms their goal differential, it doesn't repeat or continue: over time, record & points will tend to track a team's success at scoring and preventing goals. There is really no historical basis to suggest that any team can score (or prevent) The Big Goal at The Right Time and consistently squeeze more points out of the schedule than their success in scoring and preventing goals would indicate. Or, vice-versa.
Sometimes, though, the Senators seem like the exception that proves the rule. (Also, Minnesota had a higher conference rank in G.D. than in points in all 4 quarters last year.)
And the West:
There's not much to comment on here, I mainly post it at a reference point for the 2nd/3rd/4th quarter updates. The one thing, I suppose, is the Senators.
Everybody knew -- subjectively -- that the Sens were a better team than their early season record. Tyler (among others) made a objective case as well. And, their performance in the early part of the 2nd quarter (10 points in 6 games) bears all of it out.
But in the grand scheme, there's got to be a certain point where the fact that so many of their wins are blowouts ceases to be impressive weighed against their close losses, and it's appropriate to wonder if there really is an underlying issue there, whether it's character, coaching, or what.
The Sens were 13th in the conference in points but T-3rd in GD. They were +6 in their 4 games against the Leafs (3W/1L), and the loss was 6-0 -- they were +12 in the 3 W's. They beat the Devils 8-1 in there too, right on the heels of a 4-game stretch where they lost 3 1-goal games and won a shootout.
Stats types use the word "luck" to describe how goals (for & against) are distributed, and rightly so for the most part. The reason is that generally, when a team (standings-wise) underperforms their goal differential, it doesn't repeat or continue: over time, record & points will tend to track a team's success at scoring and preventing goals. There is really no historical basis to suggest that any team can score (or prevent) The Big Goal at The Right Time and consistently squeeze more points out of the schedule than their success in scoring and preventing goals would indicate. Or, vice-versa.
Sometimes, though, the Senators seem like the exception that proves the rule. (Also, Minnesota had a higher conference rank in G.D. than in points in all 4 quarters last year.)
# posted by Matt @ 10:40 am 
Comments:
I'd be interested in seeing the Pythagorean records for the conferences. It would give a better indicator of where a team like Ottawa should be.
But in the grand scheme, there's got to be a certain point where the fact that so many of their wins are blowouts ceases to be impressive weighed against their close losses, and it's appropriate to wonder if there really is an underlying issue there, whether it's character, coaching, or what.
Some studies have been done on this issue in baseball, centered around teams that vastly overachieve their Pythagorean record (The 2004 Yankees are an example. They lost big, and won small). Guys at BP (Woolner and Jazayerli) discovered that teams with good bullpens are more likely to exceed their Pythagorean record, and vice-versa. As well, teams with good bullpens and poor rotations are more likely to overachieve by winning small and losing big, and vice versa. The 2004 Yankees and 2002 Red Sox are good examples of both. To be blunt, the 2004 Yankees had an awesome bullpen, but an awful starting rotation. The 2002 Red Sox had the opposite.
2004 Yankees (+12 Pythagorean Record)
Margin of Victory/Defeat
+5 or more: 27 games
1 to 4: 74 games
-1 to -4: 33 games
-5 or more: 28 games
2002 Red Sox (-7 Pythagorean Record)
Margin of Victory/Defeat
+5 or more: 34 games
1 to 4: 59 games
-1 to -4: 50 games
-5 or more: 19 games
The games are not the same, but I wonder if there is an obvious underlying issue that we are missing as to the Sens ability to win big but lose small. Special teams, maybe?
OK, I'll bite. I've always had a bit of trouble with goal-differential, because of the blowout factor. Also I'm not really sure that goal production is the same in different scenarios (leading, tied, or trailing).
I have yet to do anything testing it out, but maybe a better metric for determining winning teams is to first:
a) think about the tied scenario. How often does this team pull ahead vs. how often does this team fall behind?
b) Once ahead, how often does that lead hold, and how often does it go back to a tied scenario?
c) Likewise for trailing.
I think what this choose-your-own-adventure thinking might do is to devalue the last four goals in a 6-1 game. Yes, they do help ensure that you hold a lead, but really they don't affect your ability to get a lead. You would score just as well if you held onto that 2-1 lead.
I don't know. Lots of people tell me that margin does not matter (leading vs. trailing), but I've seen enough hockey to know that there's differences that should matter.
I don't know if that's articulated well at all, or if it's really even on-topic, but I would be interested in some segmented studies based on what the score (or rather, margin) is. It might make the Ottawa or Minnesota story more explainable.
Post a Comment
<< Home
I'd be interested in seeing the Pythagorean records for the conferences. It would give a better indicator of where a team like Ottawa should be.
But in the grand scheme, there's got to be a certain point where the fact that so many of their wins are blowouts ceases to be impressive weighed against their close losses, and it's appropriate to wonder if there really is an underlying issue there, whether it's character, coaching, or what.
Some studies have been done on this issue in baseball, centered around teams that vastly overachieve their Pythagorean record (The 2004 Yankees are an example. They lost big, and won small). Guys at BP (Woolner and Jazayerli) discovered that teams with good bullpens are more likely to exceed their Pythagorean record, and vice-versa. As well, teams with good bullpens and poor rotations are more likely to overachieve by winning small and losing big, and vice versa. The 2004 Yankees and 2002 Red Sox are good examples of both. To be blunt, the 2004 Yankees had an awesome bullpen, but an awful starting rotation. The 2002 Red Sox had the opposite.
2004 Yankees (+12 Pythagorean Record)
Margin of Victory/Defeat
+5 or more: 27 games
1 to 4: 74 games
-1 to -4: 33 games
-5 or more: 28 games
2002 Red Sox (-7 Pythagorean Record)
Margin of Victory/Defeat
+5 or more: 34 games
1 to 4: 59 games
-1 to -4: 50 games
-5 or more: 19 games
The games are not the same, but I wonder if there is an obvious underlying issue that we are missing as to the Sens ability to win big but lose small. Special teams, maybe?

OK, I'll bite. I've always had a bit of trouble with goal-differential, because of the blowout factor. Also I'm not really sure that goal production is the same in different scenarios (leading, tied, or trailing).
I have yet to do anything testing it out, but maybe a better metric for determining winning teams is to first:
a) think about the tied scenario. How often does this team pull ahead vs. how often does this team fall behind?
b) Once ahead, how often does that lead hold, and how often does it go back to a tied scenario?
c) Likewise for trailing.
I think what this choose-your-own-adventure thinking might do is to devalue the last four goals in a 6-1 game. Yes, they do help ensure that you hold a lead, but really they don't affect your ability to get a lead. You would score just as well if you held onto that 2-1 lead.
I don't know. Lots of people tell me that margin does not matter (leading vs. trailing), but I've seen enough hockey to know that there's differences that should matter.
I don't know if that's articulated well at all, or if it's really even on-topic, but I would be interested in some segmented studies based on what the score (or rather, margin) is. It might make the Ottawa or Minnesota story more explainable.
Post a Comment
<< Home
![]()
