
Monday, July 17, 2006
Primer
Hi! I don't doubt that there's readers out there who are getting confused, nerded-out, or worse (bored!) with the stats discussions here and all over, but it's July! I thought it might be useful to sort of summarize the state & prospects of NHL Statistical Analysis, so that at the very least, all this site's readers share a base understanding of some kind.
From my perspective as a guy who likes to dick around with stats to try to learn true & interesting things, there are four kinds of hockey player statistics. I've broken them down into groups below: they are not grouped by merit or meaningfulness, but by "source": in other words, how accessible they are, how useful they are to work with, etc..
First: the basic ones, aka the ones that are already done. Any stat you can look up on NHL.com and find a number, without any further work. Goals, assists, penalty minutes, total time on ice, shots, hits, blocked shots, etc. Most of these stats are things that are counted, though there are a few that are calculated (e.g. Shooting%). No matter -- these are stats that anyone with a mouse can seek--and sort--at leisure.
Second: the subjective ones. These are the "opposite" from the first. You can't look up these stats, because the league either doesn't record them or doesn't publish them, and not all teams record them or even care about them. This group would also include stats that individual teams invent and record for their own purposes.
Scoring chances, puck battles won/lost, successful outlet passes, odd-man rushes, etc. all fall in this category. I should add here that if your aim is to construct a more rugged statistical basis for player evaluation and comparison, you probably don't want to use these anyway. Sure, you have another number (whatever it may be), but it's kind of subjective, and it has no known correlation to scoring and preventing goals, so where are you now...
Third: the "basic-plus" ones. These are stats that anyone who's somewhat computer literate can compute on their own, using stats from the First group above. An excellent example here is ESP/60: Points per 60 Minutes of Even Strength Icetime. Lots of us like this stat; it's a measure of offensive ability that corrects for disproportionate PP Scoring (high or low) and/or Icetime (high or low).
This isn't a stat you can just look up anywhere, as far as I know. However, NHL.com does publish Time-On-Ice stats for each player, broken into ES/PP/PK, and they also publish scoring stats broken down this way. You can copy and Paste-Special these tables into Excel, add some formula columns, and boom. Once you've done it a couple of times, you learn a few tricks re: how to minimize your grief.
In the context of Andy's discussion of an open-source statistics project: yeah, it would be convenient if some of these types of stats were online, but only worth the bother if they were (A) automatically updated and (B) sortable. There's not really any "work" to be done here except for the Web/technical kind, because the inputs are (by the Third group's definition) so readily available.
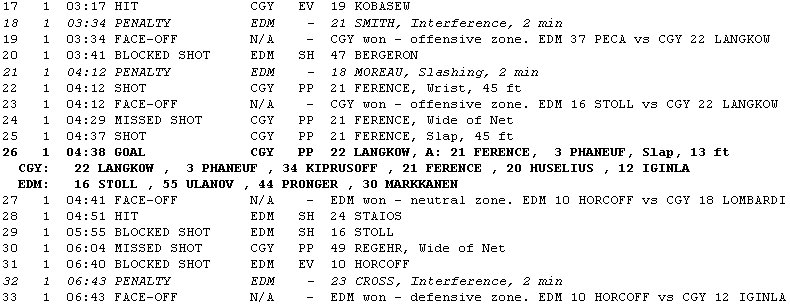
Fourth: the original and enlightening ones. This, partly screencap-ped below, is an official NHL Play-by-Play sheet; there's one for every single game, going back somewhere between 5 and 20 years.
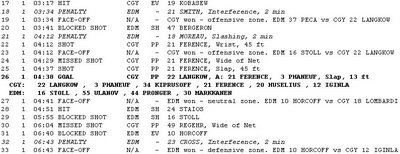 The data on this sheet, combined with the data from the Shift Reports, represents (to my knowledge) the sum total of statistical information officially recorded by the NHL for each game.
Most of the data on the sheets is collated and published at NHL.com in one form or another, but as anyone who's played around at that site knows, it's not a fully flexible database by any means.
Example: if it was, I could look up Ryan Smyth's PP Shooting% from 15-20 feet. Or, Robyn Regehr's Shots Against per minute at Even Strength in the 3rd Period. Etcetera: all the data to figure these things out exists, it's just not in a format that's very convenient, and that's a severe understatement.
However, that's not to say that it can't be done, because it is, and well. Some of the fellows at IOF have done very interesting things (e.g. Vic Ferrari - Quality of Opposition). And of course Tyler, who I'm going to use as an example here.
Tyler has published (and as far as I know, invented) the stat Expected Goals Against Average for the 30 NHL teams. The gamesheets record every shot taken; from what distance that shot was fired; the time on the game clock; and who's on the ice & in goal -- and Tyler compiles this information. [It amounts to reading every game sheet and marking it down; he has software that he has made/modified to do this for him, but he still has to collect the game sheets and run his software on each one, not a task that's overly speedy or that any jackass can duplicate in 5 minutes of spare time.]
Once this data is compiled into a workable database, there is a crazy amount of information available. This includes:
This to me is fascinating. It's also why I'm not too high on inventing new stats for a guy watching a game to record -- basically, there's a ton of fascinating things that can be done with the stats that are already recorded. I mean, right now we geeks can't even look up something as seemingly basic as how many of Dion Phaneuf's PP goals were at 5-on-3.
This seems like a good place to end today's post. I'm sure I've made at least one basic error in fact above; correct me in the comments and I'll update. I hope this helps the semi-initiated understand the challenges associated with taking NHL Stats Analysis to the next level (as amateurs, that is, with access to published materials only). They're not insurmountable at all, but it would take some work.
From my perspective as a guy who likes to dick around with stats to try to learn true & interesting things, there are four kinds of hockey player statistics. I've broken them down into groups below: they are not grouped by merit or meaningfulness, but by "source": in other words, how accessible they are, how useful they are to work with, etc..
First: the basic ones, aka the ones that are already done. Any stat you can look up on NHL.com and find a number, without any further work. Goals, assists, penalty minutes, total time on ice, shots, hits, blocked shots, etc. Most of these stats are things that are counted, though there are a few that are calculated (e.g. Shooting%). No matter -- these are stats that anyone with a mouse can seek--and sort--at leisure.
Second: the subjective ones. These are the "opposite" from the first. You can't look up these stats, because the league either doesn't record them or doesn't publish them, and not all teams record them or even care about them. This group would also include stats that individual teams invent and record for their own purposes.
Scoring chances, puck battles won/lost, successful outlet passes, odd-man rushes, etc. all fall in this category. I should add here that if your aim is to construct a more rugged statistical basis for player evaluation and comparison, you probably don't want to use these anyway. Sure, you have another number (whatever it may be), but it's kind of subjective, and it has no known correlation to scoring and preventing goals, so where are you now...
Third: the "basic-plus" ones. These are stats that anyone who's somewhat computer literate can compute on their own, using stats from the First group above. An excellent example here is ESP/60: Points per 60 Minutes of Even Strength Icetime. Lots of us like this stat; it's a measure of offensive ability that corrects for disproportionate PP Scoring (high or low) and/or Icetime (high or low).
This isn't a stat you can just look up anywhere, as far as I know. However, NHL.com does publish Time-On-Ice stats for each player, broken into ES/PP/PK, and they also publish scoring stats broken down this way. You can copy and Paste-Special these tables into Excel, add some formula columns, and boom. Once you've done it a couple of times, you learn a few tricks re: how to minimize your grief.
In the context of Andy's discussion of an open-source statistics project: yeah, it would be convenient if some of these types of stats were online, but only worth the bother if they were (A) automatically updated and (B) sortable. There's not really any "work" to be done here except for the Web/technical kind, because the inputs are (by the Third group's definition) so readily available.
Fourth: the original and enlightening ones. This, partly screencap-ped below, is an official NHL Play-by-Play sheet; there's one for every single game, going back somewhere between 5 and 20 years.
 The data on this sheet, combined with the data from the Shift Reports, represents (to my knowledge) the sum total of statistical information officially recorded by the NHL for each game.
Most of the data on the sheets is collated and published at NHL.com in one form or another, but as anyone who's played around at that site knows, it's not a fully flexible database by any means.
Example: if it was, I could look up Ryan Smyth's PP Shooting% from 15-20 feet. Or, Robyn Regehr's Shots Against per minute at Even Strength in the 3rd Period. Etcetera: all the data to figure these things out exists, it's just not in a format that's very convenient, and that's a severe understatement.
However, that's not to say that it can't be done, because it is, and well. Some of the fellows at IOF have done very interesting things (e.g. Vic Ferrari - Quality of Opposition). And of course Tyler, who I'm going to use as an example here.
Tyler has published (and as far as I know, invented) the stat Expected Goals Against Average for the 30 NHL teams. The gamesheets record every shot taken; from what distance that shot was fired; the time on the game clock; and who's on the ice & in goal -- and Tyler compiles this information. [It amounts to reading every game sheet and marking it down; he has software that he has made/modified to do this for him, but he still has to collect the game sheets and run his software on each one, not a task that's overly speedy or that any jackass can duplicate in 5 minutes of spare time.]
Once this data is compiled into a workable database, there is a crazy amount of information available. This includes:
- League average SV% on shots from X feet
- Individual goalie's SV% on shots from X feet, and thus whether they are better or worse than average on those shots, and thus how many goals their performance saved/cost their team
- Number of goals a team should be expected to allow, based on the quantity and location of the shots they allow
- Broken-out information on shots that are assumed to be rebounds (any 2nd shot within 1-3 seconds of the 1st shot)
This to me is fascinating. It's also why I'm not too high on inventing new stats for a guy watching a game to record -- basically, there's a ton of fascinating things that can be done with the stats that are already recorded. I mean, right now we geeks can't even look up something as seemingly basic as how many of Dion Phaneuf's PP goals were at 5-on-3.
This seems like a good place to end today's post. I'm sure I've made at least one basic error in fact above; correct me in the comments and I'll update. I hope this helps the semi-initiated understand the challenges associated with taking NHL Stats Analysis to the next level (as amateurs, that is, with access to published materials only). They're not insurmountable at all, but it would take some work.
# posted by Matt @ 11:46 am 
Comments:
I think the last thing you can throw into this is some sort of 'context' flags, like is it a day or night game, a back-to-back game, what is the score at the time of an event, what is the record of the team you are playing, who is in net, etc.
These aren't necessarily statistics to compile, but rather ways to further segment hockey events into better context-related groupings.
I am particularly interested in how penalties are called in regards to score or previous penalty counts within a game. I lack any necessary skills to figure it out, though.
It's also why I'm not too high on inventing new stats for a guy watching a game to record -- basically, there's a ton of fascinating things that can be done with the stats that are already recorded.
Oh, but you wouldn't believe what could be done by finding things that aren't yet recorded.
Example: if it was, I could look up Ryan Smyth's PP Shooting% from 15-20 feet.
I have a series of posts on this sort of thing that I'm going to be ready to put up by tomorrow.
P.S. great post
I didn't know where/how to fit this into the main post, but it's my understanding that the NHL does provide their stats to the 30 teams in a better, or more massageable, database than how they present it to the public on NHL.com.
What I don't know is how (or if) the 30 teams use that data. Using the goaltending example again, I don't see how any GM could look at this and decide that Ed Belfour is a better gamble than Dominik Hasek. That table is basically saying that up to the Olympic break, and correcting for shot distance (i.e. difficulty) and rebounds, that Hasek prevented 36 more goals than Belfour. That could be 10-15 points in the standings!
Using the goaltending example again, I don't see how any GM could look at this and decide that Ed Belfour is a better gamble than Dominik Hasek.
I think the problem is that they don't look at it. I mean, it boggles my mind that Hasek is still an UFA. Unless he is asking for a ridiculous sum, or his off-ice antics at the end of last year have completely turned people off, there is no reason he shouldn't be on a team right now.
Very interesting post. So what's the next step? Who has the time, programming skill, and inclination to clean up the data?
Years ago, Bill James came up with an idea called Project Scoresheet. Rather than relying on MLB, a network of fans would collect and distribute the data it wanted. Lots of companies eventually came from that process, including STATS Inc.
The next step might be to start something along those lines. Maybe you start by collecting all the data that people already have onto one site. Then you figure out as a group what data next needs to be collected. Then you figure out the best way to collect it. Then, you collect it.
My answer is oversimplified, obviously, but the potential is there. It might be best to actually figure out if the NHL will give us more information, though, before we assume that they won't.
Like Matt said, everything is already available on NHL.com. All you need are the play-by-play sheets and the corresponding TOI sheets to account for every single event all season. You might have to include the rosters page to get players who were dressed but didn't get a shift, as well as the officials.
To start, the TOI/PBP could be merged into one table. It would look like the current PBP page, but would include rows for the start/end of each player's shifts. That could be parsed into one bigass holy grail of a table. I think you could ballpark it at about a million rows for the season. From that, you could query anything your hearts desire. How about a hits +/- for every player? Average shot distance, or % of missed shots when Pronger is on the ice vs. when he's not on the ice?
It's just a matter of putting something together to do the parsing, and coming up with a database design. It wouldn't be too complicated - the aforementioned game event table, plus a player bio table (if you want to look at size/age/left/right). Maybe a game or schedule table for the game date & time, officials, etc.
Like Matt said, everything is already available on NHL.com. All you need are the play-by-play sheets and the corresponding TOI sheets to account for every single event all season. You might have to include the rosters page to get players who were dressed but didn't get a shift, as well as the officials.
That is absolutely not true. There are lots of stats on that site that are useless, and lots that aren't even there.
OK, there are some stats that aren't currently available at nhl.com. For instance, the salaries/cap numbers. Then you have the subjective ones like "Scoring chances, puck battles won/lost, successful outlet passes, odd-man rushes, etc."
The salary info isn't given for political reasons, I presume. It's understandable that the more subjective events aren't tallied, given the difficulty they have in fairly distributing hits, giveaways and takeaways. If you want fans to start counting these on their own, you're asking for a real mess.
So what else is missing? More historical data?
Andy and I obviously disagree on this point, but I will clarify:
I don't believe that the NHL is already recording every "event" that could possibly be of any use for player evaluation or comparison. But I DO believe that there is more to be gained at this point from better analysis of the events they are recording than from identifying new events to record.
I don't believe that the NHL is already recording every "event" that could possibly be of any use for player evaluation or comparison. But I DO believe that there is more to be gained at this point from better analysis of the events they are recording than from identifying new events to record.
I kind of torn on this. One the one hand I agree that there is lots to be weened from what currently exists. On the other hand, I feel compelled to question the very existence of some of these statistics, and desire newer, more precise data. I'm being a bitch by not giving a specific example, but it's because the post I have for tomorrow specifically deals with some of them.
Okay, here is one example of a stat I think is useless: plus/minus.
Good stuff Matt. Summarized well I think.
I don't know if you have read any academic papers on hockey, there are plenty of them out there. The vast majority employ wonderful math, but they are without value IMO because they were mining through reams of recorded data without actually thinkijng about what happens in a hockey game.
IMHO scoring more goals than you allow wins you hockey games. And goals happen when they happen, it usually involves some combinatiuon of luck and good fortune. Not just on the shot, but on the series of plays leading up to it.
So measuring who has an impact on creating goals for their team, and limiting them for the opposition ... these are the guys that help you win.
And since 5on5, 4on4, 5on4, 5on3, 4on5 etc are almost like completely different games; it's meaningless if they aren't separated out.
If you are a "how much" kind of person, then you're looking at goals and the circumstances that surround them. And sample size is the killer. That's why coaches prefer "scoring chances", but they are not available publicly righjt now, and highly subjective things in any case. Ruff likes "shots directed at net" ... which is a hard measure and gives bitchin' sample size, but is so driven by the players and mostly the coaches of the other team, so comparing players on different teams doesn't work so well.
If you're a "how much" kinda guy, then you care that Pisani makes his linemates better at 5on5, and just keeps getting outscoring results that are impressive considering the context (linemates and opposition). And that he's probably not a guy that is going to make an impact on the PP unit. And is pretty replacable as a PKer.
If you're a "how" kind of guy, then you care that the play rarely dies with Fernando, or that he influences zone time, or that he gets back to support the D on the breakout and doesn't cheat for offense. Or that he has a quick release on his wrister but doesn't have a onetimer worth mentioning and is good with his feet but has limited playmaking skills. (Ulanov was +2 at 5on5 when he was on the ice with Fernando, for example. Could be coincidence, but Pisani has built up enough of a pandolfo-esque history that he gets the benefit of the doubt here)
The problem with the second scenario, the last paragraph, is that you could list a whack of guys in the NHL with a similar skill set to Fernando. And you could make a compelling argument that hundreds of NHLers are better than Pisani so long as you can find a way to brush aside the actual results ... but damn few keep getting the same results.
Back to topic:
I use Excel macros to scrape info off of NHL.com. And the VBA macros to do the heavy lifting and dig up what I'm looking for. Simple stuff, millions of people could do the same if they wanted to. People who know what to look at are much rarer birds IMO.
I've been thinking that I would start a blog just for posting macro code, since there is little point in people duploicating effort. {I'm not a programmer BTW, typically I just use "Record Macro" to do something for one game, then tweak the code to make it loop through and repeat the process for all 1260 games. Slow and heavy handed. Any programmers that read it will surely mock me, but what the hell :) )
And anyone who has code that does the same heavy work (like finding when there is a 5on3, for example) could throw it up there as well.
It would surely be the internet's least read blog, but if it saves some time for the few people who have something they want to check ... then it might be worth doing.
BTW: I'm struggling to buy into the "quality of shot" stuff that I've seen on the net. The NHL just give us one dimension right now (distance from backboards) so it's dodgy from the get go. The rebounds stuff is cool, and it does filter out the wasters (like the shots from centre ice with 1 second to go in the period). ut to my eyes the team with the puck determines whether or not they take the low percentage shot, or shoot for the rebound, or whether they try and beat a player 1 on 1 or make a low percentage pass to try and create a higher quality scoring chance. I'd guess that shot quality is driven by the team taking the shot a helluva lot more than by the team defending it. I'm not sure how to prove (or disprove) my thinking though. So I can't say much to contradict at this point.
For those interested I have Dion Phaneuf down for 3 5-3 goals and 17 other goals. So that's 15%...
Post a Comment
<< Home
I think the last thing you can throw into this is some sort of 'context' flags, like is it a day or night game, a back-to-back game, what is the score at the time of an event, what is the record of the team you are playing, who is in net, etc.
These aren't necessarily statistics to compile, but rather ways to further segment hockey events into better context-related groupings.
I am particularly interested in how penalties are called in regards to score or previous penalty counts within a game. I lack any necessary skills to figure it out, though.

It's also why I'm not too high on inventing new stats for a guy watching a game to record -- basically, there's a ton of fascinating things that can be done with the stats that are already recorded.
Oh, but you wouldn't believe what could be done by finding things that aren't yet recorded.
Example: if it was, I could look up Ryan Smyth's PP Shooting% from 15-20 feet.
I have a series of posts on this sort of thing that I'm going to be ready to put up by tomorrow.
P.S. great post
I didn't know where/how to fit this into the main post, but it's my understanding that the NHL does provide their stats to the 30 teams in a better, or more massageable, database than how they present it to the public on NHL.com.
What I don't know is how (or if) the 30 teams use that data. Using the goaltending example again, I don't see how any GM could look at this and decide that Ed Belfour is a better gamble than Dominik Hasek. That table is basically saying that up to the Olympic break, and correcting for shot distance (i.e. difficulty) and rebounds, that Hasek prevented 36 more goals than Belfour. That could be 10-15 points in the standings!
Using the goaltending example again, I don't see how any GM could look at this and decide that Ed Belfour is a better gamble than Dominik Hasek.
I think the problem is that they don't look at it. I mean, it boggles my mind that Hasek is still an UFA. Unless he is asking for a ridiculous sum, or his off-ice antics at the end of last year have completely turned people off, there is no reason he shouldn't be on a team right now.
Very interesting post. So what's the next step? Who has the time, programming skill, and inclination to clean up the data?
Years ago, Bill James came up with an idea called Project Scoresheet. Rather than relying on MLB, a network of fans would collect and distribute the data it wanted. Lots of companies eventually came from that process, including STATS Inc.
The next step might be to start something along those lines. Maybe you start by collecting all the data that people already have onto one site. Then you figure out as a group what data next needs to be collected. Then you figure out the best way to collect it. Then, you collect it.
My answer is oversimplified, obviously, but the potential is there. It might be best to actually figure out if the NHL will give us more information, though, before we assume that they won't.
Like Matt said, everything is already available on NHL.com. All you need are the play-by-play sheets and the corresponding TOI sheets to account for every single event all season. You might have to include the rosters page to get players who were dressed but didn't get a shift, as well as the officials.
To start, the TOI/PBP could be merged into one table. It would look like the current PBP page, but would include rows for the start/end of each player's shifts. That could be parsed into one bigass holy grail of a table. I think you could ballpark it at about a million rows for the season. From that, you could query anything your hearts desire. How about a hits +/- for every player? Average shot distance, or % of missed shots when Pronger is on the ice vs. when he's not on the ice?
It's just a matter of putting something together to do the parsing, and coming up with a database design. It wouldn't be too complicated - the aforementioned game event table, plus a player bio table (if you want to look at size/age/left/right). Maybe a game or schedule table for the game date & time, officials, etc.
Like Matt said, everything is already available on NHL.com. All you need are the play-by-play sheets and the corresponding TOI sheets to account for every single event all season. You might have to include the rosters page to get players who were dressed but didn't get a shift, as well as the officials.
That is absolutely not true. There are lots of stats on that site that are useless, and lots that aren't even there.
OK, there are some stats that aren't currently available at nhl.com. For instance, the salaries/cap numbers. Then you have the subjective ones like "Scoring chances, puck battles won/lost, successful outlet passes, odd-man rushes, etc."
The salary info isn't given for political reasons, I presume. It's understandable that the more subjective events aren't tallied, given the difficulty they have in fairly distributing hits, giveaways and takeaways. If you want fans to start counting these on their own, you're asking for a real mess.
So what else is missing? More historical data?
Andy and I obviously disagree on this point, but I will clarify:
I don't believe that the NHL is already recording every "event" that could possibly be of any use for player evaluation or comparison. But I DO believe that there is more to be gained at this point from better analysis of the events they are recording than from identifying new events to record.
I don't believe that the NHL is already recording every "event" that could possibly be of any use for player evaluation or comparison. But I DO believe that there is more to be gained at this point from better analysis of the events they are recording than from identifying new events to record.
I kind of torn on this. One the one hand I agree that there is lots to be weened from what currently exists. On the other hand, I feel compelled to question the very existence of some of these statistics, and desire newer, more precise data. I'm being a bitch by not giving a specific example, but it's because the post I have for tomorrow specifically deals with some of them.
Okay, here is one example of a stat I think is useless: plus/minus.
Good stuff Matt. Summarized well I think.
I don't know if you have read any academic papers on hockey, there are plenty of them out there. The vast majority employ wonderful math, but they are without value IMO because they were mining through reams of recorded data without actually thinkijng about what happens in a hockey game.
IMHO scoring more goals than you allow wins you hockey games. And goals happen when they happen, it usually involves some combinatiuon of luck and good fortune. Not just on the shot, but on the series of plays leading up to it.
So measuring who has an impact on creating goals for their team, and limiting them for the opposition ... these are the guys that help you win.
And since 5on5, 4on4, 5on4, 5on3, 4on5 etc are almost like completely different games; it's meaningless if they aren't separated out.
If you are a "how much" kind of person, then you're looking at goals and the circumstances that surround them. And sample size is the killer. That's why coaches prefer "scoring chances", but they are not available publicly righjt now, and highly subjective things in any case. Ruff likes "shots directed at net" ... which is a hard measure and gives bitchin' sample size, but is so driven by the players and mostly the coaches of the other team, so comparing players on different teams doesn't work so well.
If you're a "how much" kinda guy, then you care that Pisani makes his linemates better at 5on5, and just keeps getting outscoring results that are impressive considering the context (linemates and opposition). And that he's probably not a guy that is going to make an impact on the PP unit. And is pretty replacable as a PKer.
If you're a "how" kind of guy, then you care that the play rarely dies with Fernando, or that he influences zone time, or that he gets back to support the D on the breakout and doesn't cheat for offense. Or that he has a quick release on his wrister but doesn't have a onetimer worth mentioning and is good with his feet but has limited playmaking skills. (Ulanov was +2 at 5on5 when he was on the ice with Fernando, for example. Could be coincidence, but Pisani has built up enough of a pandolfo-esque history that he gets the benefit of the doubt here)
The problem with the second scenario, the last paragraph, is that you could list a whack of guys in the NHL with a similar skill set to Fernando. And you could make a compelling argument that hundreds of NHLers are better than Pisani so long as you can find a way to brush aside the actual results ... but damn few keep getting the same results.
Back to topic:
I use Excel macros to scrape info off of NHL.com. And the VBA macros to do the heavy lifting and dig up what I'm looking for. Simple stuff, millions of people could do the same if they wanted to. People who know what to look at are much rarer birds IMO.
I've been thinking that I would start a blog just for posting macro code, since there is little point in people duploicating effort. {I'm not a programmer BTW, typically I just use "Record Macro" to do something for one game, then tweak the code to make it loop through and repeat the process for all 1260 games. Slow and heavy handed. Any programmers that read it will surely mock me, but what the hell :) )
And anyone who has code that does the same heavy work (like finding when there is a 5on3, for example) could throw it up there as well.
It would surely be the internet's least read blog, but if it saves some time for the few people who have something they want to check ... then it might be worth doing.
BTW: I'm struggling to buy into the "quality of shot" stuff that I've seen on the net. The NHL just give us one dimension right now (distance from backboards) so it's dodgy from the get go. The rebounds stuff is cool, and it does filter out the wasters (like the shots from centre ice with 1 second to go in the period). ut to my eyes the team with the puck determines whether or not they take the low percentage shot, or shoot for the rebound, or whether they try and beat a player 1 on 1 or make a low percentage pass to try and create a higher quality scoring chance. I'd guess that shot quality is driven by the team taking the shot a helluva lot more than by the team defending it. I'm not sure how to prove (or disprove) my thinking though. So I can't say much to contradict at this point.
For those interested I have Dion Phaneuf down for 3 5-3 goals and 17 other goals. So that's 15%...
# posted by  : July 20, 2006 4:43 pm
: July 20, 2006 4:43 pm Post a Comment
<< Home
![]()
