
Wednesday, January 11, 2006
Standings Watch - West
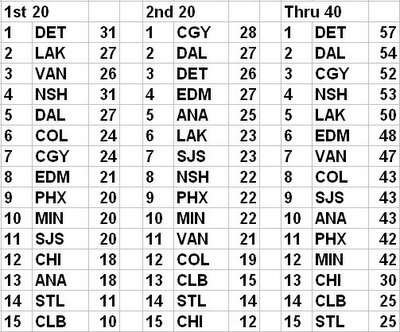
Monday we posted the East standings thru 40 games; now that San Jose has played their 40th, here's the West standings. Points:
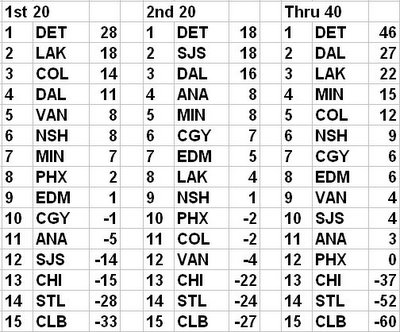
And goal differential:
Notes of interest:

And goal differential:
Notes of interest:
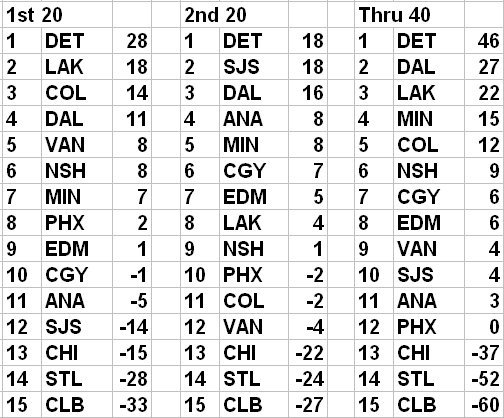
- Calgary and Edmonton obviously had very good 2nd quarters. FYI, only the 8th of the Flames' 8-game win streak a while back was in the 2nd quarter, so their top points reflect pretty consistent strong play.
- I knew Colorado and Vancouver had weak 2nd quarters, but 11th and 12th in the conference by both measures? That surprised me.
- That logjam for 8th place is something else. On the plus side, those 5 teams all have to be happy that they're still in it. On the minus side, whichever team wants to make it is going to have to play one hell of a 2nd half. (For example, the Sharks numbers look pretty promising here, but Colorado has already won their first 4 games of the 3rd quarter, and San Jose is 8 points out of the playoffs. This is what coaches mean when they say they'd rather have the points than the games-in-hand.)
- Biggest Improvement Award: Anaheim (+7 pts). Biggest Fall Award: Nashville (-9 pts). Why Aren't They Better? Award: Minnesota. Consistency Award: Dallas (2nd place: St. Louis - ugh).
- Strange Stat That Can't Totally Be Explained By Ottawa's Dominance: nine teams in the East have a negative goal differential through 40 games; only the three Shames of the Central Division do in the West.
# posted by Matt @ 10:16 am 
Comments:
The distribution of goal-differential in the East is almost totally explicable by Ottawa's dominance. On the other side the explanation is that we have two REALLY bad teams and another that's no better than Pissburgh. The net transfer of GD between the conference is only 17 goals, which is about one goal per team, so that's driving the in-conference distributions only slightly.
Where are you getting your numbers? By my calculations Phoenix also has a serious negative differential (-12).
Uh, -12 is serious? Through 43 games that's almost a rounding error. Columbus is at -59 and St. Louis -51 on my spreadsheet.
Well, it is serious compared to the positive differential implied by Matt when he said only three teams in the West were negative.
I have Columbus at -59 and St. Louis at -52. How is this possible.
My spreadsheet automatically updates from Yahoo -- maybe their standings are screwy.
Wait, I lied. Mine updates from the NHL.com standings, which is frequently behind the Yahoo standings.
Meh. It really doesn't matter. The bottomw line is that the Central division is a travesty.
The difference between my 0 and your -12 is their 41st, 42nd, and 43rd games, which they lost 4-0, 5-2, and 7-2.
I noted this after the 1st quarter, but I should repeat it as well: the GD numbers for the League do not add up to zero as it's not a closed system (e.g. because of games where one team is playing its 20th game against another that's playing its 21st, etc.).
That's why, on my Thru 40 standings, the East is -33 while the West is only +5.
Wow! I was even going to make a joke about how Phoenix couldn't have dropped 12 goals against in the three missing games -- you can't get away with anything around here.
My sheet also happens to calculate this stuff backwards from goals-per-game figures just because of the way it's set up, so occasionally I'll be off by a goal.
Also, I have to hit "refresh data" for the damn thing to be up-to-date; including the eight Tuesday games the interconference transfer is actually 18 goals.
Post a Comment
<< Home
The distribution of goal-differential in the East is almost totally explicable by Ottawa's dominance. On the other side the explanation is that we have two REALLY bad teams and another that's no better than Pissburgh. The net transfer of GD between the conference is only 17 goals, which is about one goal per team, so that's driving the in-conference distributions only slightly.
# posted by  : January 11, 2006 12:01 pm
: January 11, 2006 12:01 pm Where are you getting your numbers? By my calculations Phoenix also has a serious negative differential (-12).

Uh, -12 is serious? Through 43 games that's almost a rounding error. Columbus is at -59 and St. Louis -51 on my spreadsheet.
# posted by : January 11, 2006 2:00 pm
: January 11, 2006 2:00 pm Well, it is serious compared to the positive differential implied by Matt when he said only three teams in the West were negative.
I have Columbus at -59 and St. Louis at -52. How is this possible.
My spreadsheet automatically updates from Yahoo -- maybe their standings are screwy.
Wait, I lied. Mine updates from the NHL.com standings, which is frequently behind the Yahoo standings.
Meh. It really doesn't matter. The bottomw line is that the Central division is a travesty.
The difference between my 0 and your -12 is their 41st, 42nd, and 43rd games, which they lost 4-0, 5-2, and 7-2.
I noted this after the 1st quarter, but I should repeat it as well: the GD numbers for the League do not add up to zero as it's not a closed system (e.g. because of games where one team is playing its 20th game against another that's playing its 21st, etc.).
That's why, on my Thru 40 standings, the East is -33 while the West is only +5.
Wow! I was even going to make a joke about how Phoenix couldn't have dropped 12 goals against in the three missing games -- you can't get away with anything around here.
My sheet also happens to calculate this stuff backwards from goals-per-game figures just because of the way it's set up, so occasionally I'll be off by a goal.
Also, I have to hit "refresh data" for the damn thing to be up-to-date; including the eight Tuesday games the interconference transfer is actually 18 goals.
# posted by : January 11, 2006 5:52 pm
: January 11, 2006 5:52 pm Post a Comment
<< Home
![]()
