
Tuesday, January 10, 2006
Goal Differential Cont'd
Once again, it seems appropriate to mention that the main posts on this site are not nearly as entertaining and interesting as the great discussions that often follow in the comments section. To wit, see this post and associated comments on goal differential.
To put in my own two cents, I've always liked Cosh's method of dividing the Overall Goal Differential into its Offensive and Defensive components. Here it is as of today.
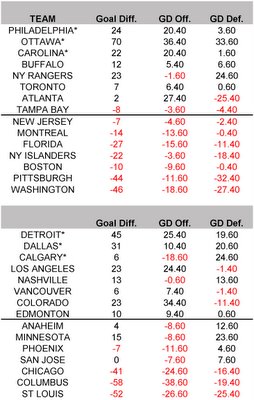
Interesting tidbits. While we already knew Calgary's +6 Overall GD is largely a result of their defense, the numbers are actually quite shocking (-18.60 on O!).
Edmonton, despite all the crying about the goaltending, Cross, and Ulanov, is atually above average (barely) in the defensive component. This suprised me.
All 8 non-playoff teams (and one playoff team) in the East are negative in both O and D, while in the West only three teams are double-negatives. The top four non-playoff teams all have decent D but can't score - hmmm, sound familiar Flames fans?
If the jackals at HF think that the Oilers are going to be able to get a good goaltender without severely overpaying, one only has to note that LA, Vancouver, Colorado, and Atlanta all have negative D components with positive O components. Good luck K-Lowe. Methinks we are going to have to hope like hell that Mac-T stops screwing around with Conklin and just starts riding Jussi until he collapses.
# posted by sacamano @ 11:40 am 
Comments:
Interesting item from reviewing Cosh's old piece: two-thirds of the way thru last season, Nashville had the highest positive residue, i.e. had a lot more points than their GD would indicate. This is true again this year or just about (Top 3).
If there is something repeatable or concrete about outperforming your GD in the Pts standings, maybe the Predators have the secret...
The Preds have a lot of similarities to the Flames. Very gritty, tight-checking and hard working, excellent goaltending, solid defence. Win a lot of close games.
They're one team that seems to have the Flames number over the last couple seasons.
The Oilers are actually second in the league in terms of shots allowed per game, behind only Dallas.
This seems to be another indicator that our D is actually a little underrated (along with the positive defensive goal diff. indicated in this chart) and thus the Oilers problems seem to be 95% in the crease.
Pronger, Staios, et al know who's back there in the crease. Preventing shots is a flat-out survival tactic.
We also lead the league in blocked shots, so that must play a part as well.
And I don't get people who complain about our top 4 defensemen. Sure, Staios can't handle a puck on a powe play, but he's pretty solid on 5 on 5. Smith and Bergeron are doing very good (although Bergeron is spotty defensively) and Pronger is everything we hoped for.
I have Edmonton a net -1 on "goal prevention" overall. That breaks into -16 on save percentage and +15 on shot prevention. Given the blocked-shots totals for every team (which I can't find) you could even hang a goals-saved number specifically on those.
Colorado 689
Edmonton 637
St Louis 619
Buffalo 606
Carolina 606
NYR 601
Toronto 583
NYI 579
Tampa Bay 574
Washington 572
Pittsburgh 567
Los Angeles 562
Boston 554
Atlanta 546
Minnesota 527
Ottawa 527
Nashville 512
Calgary 501
Dallas 500
Vancouver 500
Philadelphia 499
Montreal 488
Detroit 482
Florida 475
Phoenix 463
Chicago 457
Columbus 437
New Jersey 462
San Jose 402
Anaheim 328
I coppied this from an HF thread, but it should be accurate. There were a couple of other lists posted from people who had added them up, and they all seemed to match up.
Post a Comment
<< Home
Interesting item from reviewing Cosh's old piece: two-thirds of the way thru last season, Nashville had the highest positive residue, i.e. had a lot more points than their GD would indicate. This is true again this year or just about (Top 3).
If there is something repeatable or concrete about outperforming your GD in the Pts standings, maybe the Predators have the secret...

The Preds have a lot of similarities to the Flames. Very gritty, tight-checking and hard working, excellent goaltending, solid defence. Win a lot of close games.
They're one team that seems to have the Flames number over the last couple seasons.
# posted by  : January 10, 2006 12:49 pm
: January 10, 2006 12:49 pm The Oilers are actually second in the league in terms of shots allowed per game, behind only Dallas.
This seems to be another indicator that our D is actually a little underrated (along with the positive defensive goal diff. indicated in this chart) and thus the Oilers problems seem to be 95% in the crease.
# posted by : January 10, 2006 12:55 pm
: January 10, 2006 12:55 pm Pronger, Staios, et al know who's back there in the crease. Preventing shots is a flat-out survival tactic.
We also lead the league in blocked shots, so that must play a part as well.
And I don't get people who complain about our top 4 defensemen. Sure, Staios can't handle a puck on a powe play, but he's pretty solid on 5 on 5. Smith and Bergeron are doing very good (although Bergeron is spotty defensively) and Pronger is everything we hoped for.
# posted by : January 10, 2006 4:46 pm
: January 10, 2006 4:46 pm I have Edmonton a net -1 on "goal prevention" overall. That breaks into -16 on save percentage and +15 on shot prevention. Given the blocked-shots totals for every team (which I can't find) you could even hang a goals-saved number specifically on those.
# posted by : January 10, 2006 5:32 pm
: January 10, 2006 5:32 pm Colorado 689
Edmonton 637
St Louis 619
Buffalo 606
Carolina 606
NYR 601
Toronto 583
NYI 579
Tampa Bay 574
Washington 572
Pittsburgh 567
Los Angeles 562
Boston 554
Atlanta 546
Minnesota 527
Ottawa 527
Nashville 512
Calgary 501
Dallas 500
Vancouver 500
Philadelphia 499
Montreal 488
Detroit 482
Florida 475
Phoenix 463
Chicago 457
Columbus 437
New Jersey 462
San Jose 402
Anaheim 328
I coppied this from an HF thread, but it should be accurate. There were a couple of other lists posted from people who had added them up, and they all seemed to match up.
# posted by : January 10, 2006 9:33 pm
: January 10, 2006 9:33 pm Post a Comment
<< Home
![]()
